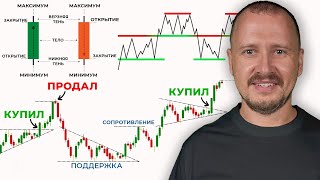

Stop Trading Without This!
45sDirectly addresses a common mistake traders make, promising a solution, which hooks viewers.
▶ Play Clip"Delivers a solid tutorial on multi-timeframe analysis with real examples, though it includes promotional segments and some repetition."
The video presents a systematic approach to technical analysis, emphasizing multi-timeframe analysis as the core of a successful trading strategy. The author, Sergey, a trader with 20 years of experience, explains that most traders fail because they enter trades on lower timeframes without understanding the context from higher timeframes. He advocates a top-down approach: first determine the direction on daily and 4-hour charts, then identify key levels, and finally find precise entry points on hourly, 15-minute, or 5-minute charts.
Beginners often trade hourly without context, leading to losses. Technical analysis is not just tools but a deep market analysis to find the best entry point. Start with higher timeframes (daily, 4-hour) to determine direction, then find zones of interest, and finally catch entry on lower timeframes.
TradingView is the #1 platform for technical analysis. On the daily chart, focus on strong key reversal zones with long approaches and significant volume. Round numbers (e.g., 4,100) add strength to levels.
A breakout on the daily chart (e.g., price flying to 4,326) is seen by the entire market, providing high potential. After a breakout, move to lower timeframes to find precise entries, but always keep the higher timeframe context in mind.
After entry, move stop-loss to breakeven and trail it along local extremes. Be careful not to move it too close, as price often squeezes. Achieve risk-reward ratios like 1:14 by letting profits run.
Practice on historical data, collect statistics, and backtest 50-100 trades before going live. Stick to your rules—don't improvise or chase entries. Trading is a job that requires time and perseverance.
Two trades taken the previous day: one on a coin with a 4-hour level and slope breakout/retest, another on a coin with a pump and imbalance. Used Bybit exchange and H for Trade screener to find opportunities.
The video builds a trading philosophy centered on multi-timeframe analysis, discipline, and backtesting. By always analyzing higher timeframes first, traders can identify high-probability setups and manage risk effectively.
What is the first step in multi-timeframe analysis?
Determine the direction on higher timeframes (daily, 4-hour) before looking at lower timeframes.
00:45
Why are round numbers important in technical analysis?
Round values add strength to a level, making it more significant.
03:49
What is the recommended risk-reward ratio for a basic trade?
1:3, 1:4, or 1:5, but can be higher with trailing.
20:13
How many backtested trades are suggested before going live?
50-100 trades on historical data.
33:20
What is the 'imbalance' concept mentioned in the video?
A price jump that is out of balance; according to trader beliefs, this imbalance will be covered by the price.
32:13
Top-down analysis principle
Explains the core methodology that prevents common trading mistakes.
00:45Round numbers add strength
A practical tip for identifying more reliable support/resistance levels.
03:49Trailing stop-loss to breakeven
Shows how to protect capital and let profits run, achieving high risk-reward ratios.
07:53Backtesting before live trading
Emphasizes the importance of historical validation to build confidence and consistency.
12:10Imbalance and price coverage
Introduces a key concept for understanding price movements and entry timing.
32:13[00:02] beginners on technical analysis. This video explains what you shouldn't do without opening an exchange or starting trading. Let's go over all the important aspects. Let's learn how to open deals like these, forget about the word " liquidation," and build a personalized
[00:18] system for everyone. My name is Sergey. I am the author of the SRKrypto channel, a trader and investor with twenty years of experience. Let's go. Please remember that I do not provide financial advice in my videos. Everyone is responsible for their own decisions, so
[00:31] be vigilant. Everyone knows the words level, trend, momentum, correction, but no one explains how to put this together into a system and how to apply this system in such a volatile market. Most people enter the hourly timeframe without
[00:45] context. You see a rebound, you move, but on the daily chart there is simply a correction to short and you are washed away again. Technical analysis is not a set of tools; it is an in-depth analysis of the market followed by a search for the most successful entry point into a
[00:59] position. First, you determine the direction on higher timeframes, daily, four-hour, then you look for a zone of interest and only then on lower timeframes you catch the moment of entry. If you want to stop guessing, start
[01:13] looking not from left to right, but from top to bottom. This is multi-timeframe analysis. You can't trade hourly if you don't understand what's happening on the daily. The higher timeframe is the mouth of the mapap zone where there is profit. There is
[01:27] nothing to do without it. So, let's open, for example, the ether chart. As I said, let's start with the daily timeframe. This is Trading View, the number one platform for technical analysis. All the tools, indicators, and
[01:40] alerts at the level are here. For example, you can set up a market simulator. Here we collect our watchlist and many other useful tools. There is a registration link here. For those who haven't registered yet, I'll leave it in the description below the
[01:54] video. Ether is a heavyweight coin, moving technically, clearly, and as predictably as possible, so we'll be analyzing it here. What's good about the daily chart? Here each level has its own weight. Naturally, we don’t take into
[02:10] account any smaller levels at first , for example, where there was a short approach, a short retreat. Here, for example, there is also a level, but they are less significant, although they also work well. We are starting to get into the
[02:23] stronger levels that we can find on the chart. The strongest key reversal zones, which provide excellent potential for trading. For example, we see here how long the approach was, and the price was reversed.
[02:38] Then the same picture again. Approach, they turned down the price. This is a daily timeframe, that is, these extremes, reversal points were formed for us: the first one was 100 days and the second one was 244 days. That is, these are not some
[02:53] small rebounds, but a truly huge area of interest for the entire market in the coming years. Here we spank our level, which we begin to analyze. We learn, first of all , from history, and then
[03:07] we try to apply this acquired knowledge, observations, and patterns in practice. So, let's figure out how it all works now, and then we'll look at yesterday's fresh deals, get comfortable, like, write
[03:22] comments, subscribe to the YouTube channel so as not to get lost, and also subscribe to my Telegram channel. There I post the latest news in the world of cryptocurrency, various bonuses and promotions. The link will be in the description below the video. And
[03:35] now let's follow further what happened with our discovered level. First, we look at the mark at which this level is drawn. When we look for strong daily levels, we are interested in round numbers. Here we
[03:49] see 4.091. Click on the level, take the setting, press the gear and try to round it up to 4.100. That's it, 4.100. We see that our level has clearly settled. by the tails. Round values will always add
[04:05] strength to our level. And then we observe how the breakthrough occurred. That is, we are not on the hourly basis, we are simply entering a rebound here, which, as we see, did not even happen. We are looking at how the level works on the daily timeframe. We will always have time to move to an hour,
[04:20] [music] fifteen minutes, five minutes, but it is important to determine what potential we have on a higher time frame. Here, as we can see, there is a breakout by one candle, and not just by going slightly beyond the level, but by a
[04:33] very good breakout. That is, our level is at 4.100, the price flew up to 4.326, to be precise, and closed beyond this level. We understand that, yes, on the daily timeframe we have a breakout. And this is
[04:48] already our first area of interest. This breakout was seen by everyone who trades five-minute, fifteen-minute, hourly, and four-hour timeframes; the maximum number of participants, the entire market sees this breakout. Naturally, we will have
[05:03] good potential here. And now let's cut off this piece, go down to the same hour, on which we see a good trade. Here we can already look more specifically, look for some local levels, local trends. In
[05:19] this case we have a clearly defined, understandable sidewall. Both support and resistance are clearly visible. The levels that are below the chart are called supports, that is, they kind of support the chart.
[05:31] The levels above are resistance. If you delve into some philosophical understanding, they resist the schedule and do not allow it to break through higher. And now that we know that a
[05:44] strong level was broken out on the daily chart and consolidated, we can calmly look for our trading situation on the hourly chart. Nobody is stopping you from switching to fifteen minutes. Here we can already look for some inclined levels, combine
[05:58] the chart into trends and look for a more precise entry point. For example, we see that the price has arrived, the trend line is starting to trade something for us here. Let's chip in for another five minutes. Yes, indeed, there is some kind of trade. We highlight this
[06:13] trade and observe what happens next. That's it, we've made it to the market. There is an entry point, there is a place to hide the stack right behind the trading platform before the level, or a little further away. Here we also had a small red
[06:26] candle, a small knee and we pull the profit to the upper border of the hourly corridor. That is, we know that we have a resistance level here from a higher timeframe. But we also remember that we had a breakout of the level on the daily chart,
[06:40] the potential could be much higher. That is why in this deal we can sit back, and pull, and try to take more. And we watch what happens next. We see everything, here we have a clear entry into the resistance level.
[06:55] The price has reached this level, penny by penny . Moreover, the reversal point itself was taken from the first extreme. That is, here we have defined for ourselves the basis to the level. Naturally, we could draw a level and thus there would be a
[07:08] foundation here. Here we would have confirmation by stabbing. But on the hourly timeframe we saw that our base was located specifically in this place. Then we pinned the level once, pinned it a second time, and then
[07:23] clearly touched the same level again. That is, we try to combine all possible level touches as much as possible. Even though it was a precise touch, penny for penny , even with some hooks,
[07:39] see, we have a clear structure. Let's draw it like this and see the specific, clear sideways movement that the chart has drawn for us. You can even watch it on a five-minute video. And here the choice is ours. We either close
[07:53] the position, as planned, at the upper boundary of the sideways movement, or we move our stop-loss to breakeven and gradually pull it up to any local extremes that have formed. These are the turning points. First of all, we
[08:08] understand that we had one touch, a second touch, a third. That is, even seeing these three approaches here, and they stabbed once, stabbed a second time , the level is even higher, they intend to break through. Whether they will break through or not, we
[08:22] cannot know for sure. We understand that with a higher degree of probability, when the level has already been spiked so many times and the price returns to it again, already the fourth approach, we can count on its breakout. Well, naturally, this
[08:35] story, we already know in advance that approximately, yes, somewhere around here the price will go higher. But to start acting in a real situation this way, we need to run through all these situations. And, as we can see, the moment with breakeven. If
[08:48] we had moved the stop-loss a little closer, the price would have easily broken through it and moved on without us. That is, without loss. The matter is also delicate. Sometimes it's better to be a little higher than the entry point to cover some exchange commission and not [music] rush to
[09:03] pull it higher, because the price will often squeeze even more. Even after some local levels of supposed support have formed, it can still squeeze and take out our stop-loss, which we moved to breakeven. Well,
[09:16] as we can see, the position here continues to expand . For example, already 1: PI. Here, of course, we can already move our stop-loss to the support level. That is, this was resistance for us when the price was below this level. Now this
[09:30] has broken higher. In this way we drag out the deal further. We see that some kind of extreme has formed. We understand that if the price drops now, we won’t even get our one to three. Therefore, you can now gently
[09:44] pull the stop up further. Or even 1: already, in principle, a good profit. We set the stop at level 1:5 and we don’t care anymore. We have a deal, if it closes, we will already take the profit, if it goes further, we will push the stop further. It doesn't
[09:58] matter anymore. We see that some other extreme has formed . Let's tighten it up a little more. Then came the price. We're still [music] dragging on a little bit. Another knee problem. The stop light was tightened. The price has gone up again. We tightened the stop loss. We see it goes further.
[10:12] You can tighten it up some more. We're pulling it up. Well, we ourselves already understand that some kind of reversal is happening here . That is, we see that our highs were updated, updated, and at some point it was already clear that a sideways movement had formed at the top. [music]
[10:24] Often the price turns out exactly like this . That is, we have, let's draw this moment, an update of the maximums. And at the top, when the trend has already developed well, we often see a reversal through this kind of
[10:37] sideways movement, some kind of consolidation. Here it is clearly visible and understandable that the price is no longer updating any [music] highs. The price is simply hitting once, twice , three times, four times [music] against some invisible barrier. It is also
[10:50] important to notice this, just to fix the image somewhere in your head. Trends often unfold through some kind of rounding model, starting to stall in place. [music] This helps to look for good reversal
[11:03] points to enter a complete trend reversal. And let's assume that our stop-loss is knocked out. Well, naturally, this is not a stop-loss at a loss, this is our profit. We simply use a pull- down stop-loss to keep the position
[11:16] already in profit when this stop-loss is triggered. So, let's say, if we sat and pulled conscientiousness into this position, [music] 1 to 14, as we see, here in this instrument the risk is shown, the profit ratio of 1
[11:28] to 14 was taken away. Naturally, such a situation needs to be found. Of course, you need to spend time here on schedule. Such deals are achieved through hard work and perseverance. Trading is, in principle, a kind of job. This is not some kind of
[11:42] magical knowledge that you can apply and just snap your finger and pull to take money from the market, you naturally need to give up your time in return. And now we have modeled a trading situation that
[11:57] could have been worked out [music] historically, and we remember how it all timeframe and see what we've accomplished here. One single daily candle gave us a reliable potential, a
[12:10] reliable place, [music] where we were more likely to get a good entry point and literally two daily candles could have given us a pull. The risk-reward ratio is one [music] to almost fifteen. Let's say if we have a risk per
[12:24] positive trade we [music] take $150. I think that to achieve this result it is worth being patient and perhaps waiting out some series of stop-losses. You shouldn't think that such situations on the market
[12:39] happen once a year and you will never find them. It’s better not to even try, but to jump for fifteen minutes straight away and grab some short movements. Yes, this is also an option, it also works in its own way, but when you don’t see higher
[12:53] timeframes, there is no understanding of what gives us potential and how strong it can be five-minute timeframe, for example, from a fifteen-minute timeframe, was some kind of weakly traded trend. We have one touch here, a second, yes, there is a
[13:09] small third touch. Well, what potential could there be here according to the standard? This is just the beginning of our tilt. And since we see that here we also have a level from a sideways movement of a higher level, for example, we accidentally
[13:21] noticed it and raised our head there a little higher for fifteen minutes. All. This is our entire potential that we can count on, without paying attention to higher timeframes. Here I would like to add that we are primarily
[13:34] developing a trader’s mindset. Before entering a trade, we always conduct a comprehensive technical analysis, starting with a higher timeframe, identifying strong levels and determining our potential. what's happening on
[13:46] the timeframes above. Even such a cursory analysis before opening a trade on the same timeframes gives us a huge advantage. No need to spend a lot of time. We literally looked at the daily time frame for a few minutes,
[14:01] perhaps dropped down to the four-hour time frame - this is also a higher time frame, which can give us good levels. And now that we understand what's going on above, we dig in and look for our perfect entry point into the deal. It is important to understand what will
[14:14] give energy and impetus to the movement we want to take over. Based on this approach, I took two pretty good deals yesterday. Next, we will definitely analyze in detail the basis for the entry and how
[14:26] the analysis was carried out from top to bottom. Don't forget that the channel always offers a free trading training playlist: trading from scratch, a solid foundation. Let's go in and strengthen our knowledge. Now my team and I have put together a comprehensive
[14:40] training course on trading, covering everything from the very basics to confident trading. This course is a distillation of all my knowledge, accumulated over 20 years, presented in a structured, step-by-step manner. The course
[14:52] takes you by the hand from the first steps to the start of real trading using ready-made strategies from the course. You also receive not just video lessons, but constant feedback, homework assignments, homework review, and a
[15:06] community where you can communicate and discuss your trading . [music] I personally also follow the learning process and take an active part. You can find all additional information about this
[15:20] course by following the link in the description below the video. And by the way, right now in honor of Black Friday we have additional gifts and discounts, so go ahead, check them out, and continue browsing. Let's remove this situation from
[15:35] the graphics, if anyone doesn't know how to delete multiple objects at once. We hold down the Ctrl button, then the left mouse button, select everything that we no longer need, and press the DEL button. Let's quickly look at one more
[15:50] situation and move on to analyzing transactions. We have already covered this level. It is important to understand why we carried it out and how we worked with it in the future. And now we have one more level below. It is visible to the naked eye. We see that we
[16:06] had a repulse here. Here the price jumped and bounced back quite well. [music] Naturally, we pay attention to how this approach was formed in our country. We see a long spire, a candle shadow, we see a huge volume. At this [music] point
[16:20] the price has already received strong support. That is, here we have a level formed by minor touches from the daily time frame, but in this place there was already a strong base for it. And we got good confirmation. Next
[16:35] we see how long the shadow is. That is, here even the candle doesn’t have a body. The body is somehow small. The price was literally pushed down in one day and bought back as quickly as possible . We also see what the volume is. Next, there is another candle on the daily
[16:49] timeframe, which shows us that the level has been broken. The candle closed behind [music] this level, that is, it was not protected, the price was not bought back, it was not pushed up. All this is everything that we essentially need to see during the day. Now
[17:03] we can calmly dive for our hour, fifteen minutes, five minutes. We cut the graph again. We leave only the candle that broke through the level and stabilized. Let's chip in for an hour. Let's see what's going on here.
[17:17] Why are we going through all this in history? Because this is what real-time trading should look like. That is, the structure of thinking, analysis, and technical analysis occurs in exactly this way for the most effective trading. And
[17:31] here we are in no hurry, [music] we are looking at what the price will draw for us next. As we can see, they pricked the level. We'll go down for fifteen minutes. We understand that on the daily timeframe we have already had a breakout with consolidation
[17:44] below. below the level, but on lower timeframes the price is still trying to break it upwards. Therefore, here we can already look for some kind of slope, our favorite one, see how the price will interact with it , the price simply
[17:58] flies past it. That is, here we are already specifically looking for an entry point. On a lower timeframe, we understand that the level was spiked, once, spiked, twice. Here, as we can see, the price clearly reacted to this level, that is, it was drawn
[18:11] on the daily timeframe, but, naturally, the price will also react to it on lower timeframes. As we can see, clear arrivals, touching here, here. Here again you can notice some kind of reversal pattern, a double top. That is, once you have
[18:26] caught the entry point here, this is the next thing. It is important that we understand the potential for a downward move. [music] It would have been possible to to catch on on a five-minute time frame, but here the price flies by, it simply doesn’t
[18:42] even give the opportunity [music] to enter somewhere on a rollback . This was a nice place, but again it was a bit early. Although also, if we use the tilt-in- tilt model, as I call it, that is, we have a higher tilt,
[18:56] here we have some more local tilt. A slope is a slanted level. It is formed by two points. One, two. That's it, we have a trend support level. Once again, one, period, two. We see that a breakdown has occurred, and we
[19:09] are rolling back. And from here it was already possible to calmly pull off the deal. Nobody forbids us to catch some horizontal levels, for example, in this place. Try [music] to find an entry point to break through this level. We see that
[19:23] the price has come up. He showed us a small market stall . That is, they hit each other once with a candle, fought back, twice, [music] fought back. A small but significant reduction to the level. There was even some small but significant reduction to the level. There was even some good trading going on. Yes, the breakdown has begun
[19:36] . Well, not bad, of course. More often than not [music], as I try not to enter right at the moment of the breakout, we don’t even understand whether the candle will close beyond the level or not. We might see some kind of spike here, and the price will roll back up. That
[19:48] 's it, our stop loss will be blown away. That is, in order for us to be confident in a breakout, what is the breakout sign? We will also talk about rebounds later using the example of transactions. We are consolidating the level. That is, this red candle,
[20:01] which poured down, closed behind the level, everything gives us the understanding that [music] naturally, we insert a limit pending order. We hide the stopper. Well, either for this little trick, which is a
[20:13] more extreme stop-loss, or for this whole market here. You can hide your stop-loss behind it [music]. And as I already said, we can set the basic ratio to one to three. one to
[20:27] four or one to five, or we try to squeeze out the maximum number of transactions, but the price, as we see, is not adjusting as we would like. This is also another important point. It's not always the case, even as this analysis of historical
[20:42] data clearly illustrates, that you won't always have time to enter into a deal at this particular moment. Therefore, if we have clearly decided that we are waiting for a breakout, a retest, and only then enter, then such situations should not push us to start catching up somewhere
[20:57] in this place, in this. Yes, sometimes, of course, this is appropriate, but here it is very important to adhere to your own rules, because if we start improvising, entering differently each time , here we wait for a retest,
[21:10] somewhere we rush in to catch up, as a result, trading turns into chaos. Therefore there is no retest. Let's look further into the situation. All. As we can see, the price continued to move up . It's OK. Well, let's say we managed to get a foothold here and already pulled out
[21:23] a deal. And the most important thing here is not to continue to get confused in all these local levels, because here you can already start looking for some kind of slopes, horizontal levels. It's easy
[21:36] to get confused in such a situation. Let's move up to the hourly timeframe. That's it, we're deleting this. We didn't have time to enter this place. It's okay , absolutely nothing happened during the day off . Here we have a candle that has fixed itself above the level. The second
[21:51] red candle shows us that yes, indeed, a specific breakout of this level on the daily time frame is already underway. But let's not forget that retests occur on all timeframes. This means that we still have a possibility of a retest of the daily
[22:06] level from the opposite side. Therefore, we can wait in this place and wait until the price comes here again. already in its fifteen minutes, for example, more masterfully. We're just observing. Trading is always about
[22:19] observing. Trading is always about observation, waiting in ambush and searching for the best entry point into a trade. As we can see, we have moved away from the level, that’s it, the price is simply consolidating, there is no fuel. If here we had a good push from the
[22:33] daily timeframe, that is, the impulse itself, the potential itself gave us the daily moved away from the level, that’s it, some uncertainty sets in, some people are buying, some are selling. This is our place
[22:47] where we are on duty, approximately. That is, near the level the price will come here, or here, or here, we are not interested in this. We are just waiting for our situation. All. As we can see, our price simply stagnated below the level for 8 days. We don't have just one coin
[23:02] . This does not mean that we sat for 8 days and just waited. Naturally, we can trade some other situations, but we keep in mind that we have a possibility of a return to a strong daily level on the ether, and we can again
[23:16] find some entry point. And after some time, the price again comes to our daily level on the fifteen-minute chart. we see the reaction. About 13 days have passed since the first breakthrough . As I already said, we haven’t just been
[23:30] sitting around doing nothing for these 13 days. There are many situations on other coins, but when we see a repeated approach to the daily level, we already begin to look for our entry point. As we can see, the price is starting to be haggled over. That is, we
[23:43] have a side track, we can now move on to a five-minute track. And here it’s already more delicate to try to find the entry point. It would be a good idea, of course, to wait for the local resistance level to arrive , which we have drawn
[23:58] right below the daily level, since here, as we can see, the level simply sawed through this local slope. Well, for example, we place a limit order here. We hide the stop loss behind the daily level. Here we will have
[24:11] protection at both the local and daytime levels. And the take profit, naturally, we can throw away at least one to three. But once we're already in a trade , no one's stopping us from gradually moving our stop-loss to breakeven. And as the price falls, again, we do
[24:26] n’t forget that our stop loss can easily be knocked out now if we move it too close. That is, we need the price to sink somewhere. Overall, as we can see, there was some kind of consolidation here again. We
[24:39] successfully fell out of it. When the price has already sunk well, of course, we gradually tighten our stop-loss. Again, we will often have such upward jumps, so here we also need to, so to speak, do this carefully. Well, we see that a
[24:54] good knee has already been drawn. You can also pull the stop-loop by it. And on such a drain, in principle, we see what enormous volumes there are. Here the candle has already cast a shadow. That is, well, here it is already advisable to fix the position, and not
[25:09] try to pull anything out. That is, here in any case, if we pull out such a in any case, if we pull out such a deal, it is already 1:17, 1:18, that is, again, $10 risk, for example, $180 profit. Let's remember where it all
[25:23] began. Let's return to the daily timeframe. Let's summarize what we did, what tools we used, how much time we spent on it. one level on the daily timeframe with strong reversal points at which the
[25:38] maximum historical volumes were formed . Next, a breakout by a daily candlestick, a return to the level that we have already traced on a lower timeframe. That is, yes, here, simply on the daily chart, there was a breakout and retest, which we
[25:52] already worked out more precisely on the fifteen-minute and five-minute charts. Literally here are 1 2 3four daily candles. That is, from the daily time frame, this movement looks like just some small slap, so to speak.
[26:06] But on the lower timeframes we captured a huge movement. Naturally, sometimes the price can fly this distance in one day, or even half a day. Here, yes, the deal lasted for 4 days, for example. So. And let's move on to analyzing the
[26:20] deals I made yesterday. There are just similar interesting situations there. Bybit crypto exchange for my trading. This is the top crypto exchange in the world. It features a user-friendly
[26:32] trading terminal, spot futures trading, a variety of earning tools, Spot X, primarket, trading, copy trading, and trading bots. In the Banking ERN section, you can open a crypto deposit. You can also open a
[26:47] payment card for yourself, just like a bank card. Only here you can pay for purchases with cryptocurrency. After registration, we go through the verification process in the "Buy Cryptocurrency, P2P Trading" section. You can top up your balance using a
[27:02] bank card or any payment system. I'll leave a link to register with maximum welcome bonuses in the description below the video. Don't miss your chance. And if you don’t understand something, go to the channel,
[27:15] playlists. There is a whole playlist of BYбиit training here. Bybit for beginners. In virtually all your questions about the BBIT crypto exchange, as well as a wealth of ways to earn money on it. The first
[27:30] earn money on it. The first deal is a Sony coin. This is exactly how it all happens in reality. Here my senior was the four-hour time frame. A level formed, of course, not as strong as the one we
[27:43] looked at today, but again, there were already a number of factors that came together and gave me an entry point. We see on the next approach that we can also see on this timeframe that a good shadow was formed on the candle, that is, sales clearly started from here again
[27:58] , paying attention to such simple and clear signs as the senior level, how we approached it, that is, this shadow was formed, there is a reaction to the level on four hours. Next we move to the hourly timeframe, there is a slope of 1
[28:14] to the hourly timeframe, there is a slope of 1 2 three touches, a breakout, a retest. And already, I I took this deal. [music] A short deal. At five minutes she was already working. It turns out that here we have a local level. We broke through the slope and
[28:28] went for a retest. Moreover, [music] retest here again we see a shadow. When the price approached this point for a retest, there was a real sell-off. They tried to push her back. Here I already understood that this [music] tail gives
[28:41] the prospect that the price will now be pushed down again as quickly as possible. Here again we have some kind of tilt. And he no longer sat through anything. A short, beautiful deal. Here is a red bird entering, a green one going into shorts. [music]
[28:55] The deal worked. That is, I just trade. Then, at any moment, I can come back, look at a particular transaction, examine it on different time frames, and see what the volumes were. For those who haven't registered,
[29:07] I'll also leave a link to the trading diary in the description below the video. Next deal coin clanke. There is also a very interesting situation here. Let's see how it looked for us from the timeframes above. Again, four hours as a basis. We had a
[29:21] good price bargain here. Now let's look at the lower timeframes. There was a little loop here too. We have created such a level. And this candle, by the way, that was one of the reasons for entry, when the price flies up to some level,
[29:37] immediately approaches it, then starts to trade, maybe merge again, then gain some momentum , approach a breakout, go. And here's such a long candlestick approach, plus here we hit a good
[29:50] four-hour level. This is already a warning sign that there may be a good drain down there. That is, the so-called pump [music] the price was simply pushed up by some, maybe even one order. Someone bought into it for a huge amount of money, as we see here.
[30:03] [music] Bang up, then down. By the way, I found this and the previous situation using the H for Trade crypto screener, which time when similar situations occur in the market —pumps,
[30:18] dumps, strong divergences, and convenient; you don't have to sit and sort through coins manually, looking for these quickly jumped, switched, as I already said, for a couple of minutes to a higher
[30:34] time frame. Here, literally for four hours to throw. Even on the watch it was already visible. We clearly have a good trade going on here. A large volume was traded here, as evidenced by these candles, which hit
[30:48] practically the same place, in this zone. That is, there was some significant accumulation of sell orders here, which pushed the price down. That is, here the price gradually tried to break through, they sold, broke through, sold. Again
[31:03] approaches, approaches. And here you can clearly see from the candles that they are selling, selling, selling. Well, in the end they leaked it. That is, someone tried to push their way up with purchases, but could n’t resist. And, naturally, that's all. We already understand that on lower timeframes
[31:16] we have the maximum potential for a downward drain on a repeat of such an approach. downward drain on a repeat of such an approach. find such situations manually without any problems. The screener simply saves time
[31:32] on sorting through these coins. And we can react more quickly when we experience sudden outages like these. Reversal points are formed . It also helps to monitor this additionally. And we go down below for
[31:46] fifteen minutes. The basis for entry, that is, above, we have already carried out the analysis. We understand that we are catching a plum now. Here is our approach point. Here we have a reversal candle. at fifteen minutes. Well, this is already an additional
[31:59] factor. That is, a long tail on top and a shorter body on the bottom. And, please, on the five-minute timeframe we had a small inclination, a breakout, a retest, and a clear entry. 15% of net movement and transactions were taken. What we have
[32:13] here is what is called imbalance, a tricky word, but it means that the price is out of balance. Balance is when we have this kind of sideways movement, the price is treading water, it is in balance. balance between
[32:26] buyers and sellers. When the price makes such a jump, it is called imbalance. And according to trader beliefs, this imbalance will covered by the price. Well, as we can see, it was indeed completely blocked,
[32:40] almost to the very root, and from there a rebound began. Of course, I placed the profit a little before reaching the base of this stick, this overhang, because this is not a 100% guarantee that the price
[32:53] will reach the very bottom. sometimes it stops somewhere in the middle . Therefore, here you also need to understand that you can set your take profit a little before reaching it. So, in today's video we built a system of thinking, I would say, a
[33:07] trading philosophy. Multi-timeframe analysis is what gives us market insight and potential for our trades. Let's repeat once again that it only takes a few minutes to move up to a higher timeframe before
[33:20] opening a trade on a lower timeframe to assess the prospects and potential of our position. Of course, don't forget to practice on history, collect your statistics, conduct backtests, 50-100 trades, find results first on history,
[33:34] then move on to real trading and gradually improve your results. Don't leave comments, and subscribe to the YouTube channel so you don't get lost. Telegram channel, the link will be in the description under the video. Come, I'll be
[33:49] glad to see you all. That's all from me. All the best and successful trading.
⚡ Saved you 0h 33m reading this? Transcribe any YouTube video for free — no signup needed.