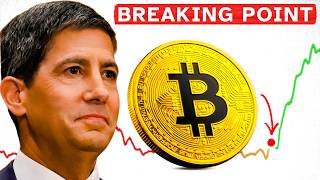

Fed's Hawkish Move: A Sign of Weakness?
45sChallenges the mainstream narrative, creating curiosity and debate about the Fed's true intentions.
▶ Play Clip"Delivers a solid, data-driven analysis that matches the title's promise, though it includes a sponsor segment and some repetition."
The video analyzes the Federal Reserve's recent decision to hold rates steady with three hawkish dissents, arguing that this apparent strength is actually a lagging indicator of economic weakness. It draws parallels to the 2006-2007 cycle, highlights stress in credit markets, and predicts that Bitcoin, as a liquidity-sensitive asset, could see a sharp rally once the Fed is forced to cut rates.
The Fed held rates for the fifth consecutive meeting, with three officials voting to hike. New Fed Chair Kevin Walsh said, 'I asked for a good family fight and I got one.' The video argues this is not strength but a sign of an impending pivot.
In June 2007, the Fed had held rates at 5.25% for 15 months and sounded confident, but 10 weeks later it cut by 50 basis points in a panic. The video suggests a similar pattern may be unfolding now.
Across tightening cycles (1984, 1989, 1995, 2000, 2006, 2018), the median gap between the final hike and first cut is roughly 7.5 months. Hawkish resolve at the top is a lagging indicator, not strength.
On July 27, Nvidia's 5-year CDS hit 82 basis points, an all-time high, jumping 14 basis points in a single session. This is despite Nvidia being a $4.6 trillion company, signaling credit market stress.
Oracle's CDS is above 200 basis points, Meta at 93, Alphabet at 65, and Amazon's CDS at 855 basis points, implying a ~50% chance of default within 5 years. Credit markets are noticing something equities haven't priced.
Private credit default rates hit a record 6%. US commercial bankruptcy filings are up 13% YoY, small business Chapter 11 filings jumped 50%, and large corporate bankruptcies hit 372 in H1, the highest since 2010.
June jobs report showed 57,000 payrolls vs 115,000 expected, with 74,000 revised away. Unemployment fell to 4.2% only because 720,000 people left the labor force, dropping participation to 61.5%, the lowest since March 2021.
The reverse repo facility has drained from $2.5 trillion to near zero (376 million). Bank reserves sit near $3.1 trillion, scraping the bottom of 'ample.' The Fed has been buying Treasury bills since January to keep reserves topped up.
Walsh served on the Fed Board from 2006-2011, designing emergency liquidity facilities during the 2008 crisis. His formative experience suggests he is likely to open the taps when funding markets seize up.
Jackson Hole (Aug 27-29) is Walsh's first keynote as chair, with five internal task forces. September 15 is corporate tax date, draining reserves, and the FOMC meets September 16 with fresh projections.
Phase one: correlations go to one, everything sells, Bitcoin often sold first (March 2020: -50%). Phase two: Bitcoin reclaims ATH within months and outperforms. The turn often comes before actual rate cuts.
Spot Bitcoin ETFs had first negative half-year with $5.4B outflows. Futures open interest near $47B, with $700M liquidated in a day. Retail is net long 63%, but long-term holders control a record 83% of supply.
30-year Treasury yield hit 5.2%, highest since 2007. Term premium has turned positive. If it keeps climbing while the Fed eases, the liquidity impulse gets absorbed by bonds, invalidating the bullish thesis.
The video concludes that the Fed's hawkish stance is likely a prelude to a sharp pivot, as history and credit market stress suggest. Bitcoin, as a liquidity instrument, could see a massive rally once the Fed is forced to act, but the bond market's term premium is a key risk to watch.
What is the median gap between the final Fed hike and the first cut across recent tightening cycles?
Roughly 7.5 months.
01:09
What happened to Nvidia's 5-year credit default swap on July 27?
It hit an all-time high of 82 basis points, jumping 14 basis points in a single session.
02:22
What was the private credit default rate earlier this year?
A record 6%.
04:06
Why did the unemployment rate fall to 4.2% despite weak job growth?
Because roughly 720,000 people left the labor force, dropping participation to 61.5%.
05:39
What is the reverse repo facility's current level compared to its peak?
It drained from a peak of ~$2.5 trillion to effectively nothing (376 million).
07:06
What is Kevin Walsh's formative experience that may predict his behavior?
He served on the Fed Board from 2006-2011 and designed emergency liquidity facilities during the 2008 crisis.
08:04
What are the three things to watch between now and September?
A sharply negative payroll print, sustained friction in repo markets, and a default cascade in private credit.
09:57
What happened to Bitcoin in March 2020?
It fell roughly 50% from ~$8,000 to under $4,000.
11:09
What is Bitcoin's sensitivity to global liquidity according to Michael Howell?
Around 9.5 times.
11:58
What was the net outflow from spot Bitcoin ETFs in the first half of the year?
$5.4 billion, the first negative half-year ever.
12:14
What percentage of Bitcoin supply do long-term holders control?
About 83% (16.64 million coins).
12:42
What is the term premium and why does it matter?
It's the extra return investors want for locking up money longer. If it climbs while the Fed eases, the liquidity impulse gets absorbed by bonds, invalidating the bullish thesis.
13:20
Hawkish resolve is a lagging indicator
Challenges the mainstream interpretation of Fed strength, offering a contrarian view based on historical patterns.
00:17Nvidia CDS at all-time high
A concrete, surprising data point showing credit market stress in the most profitable company.
02:22Labor force drop masks unemployment
Explains a statistical anomaly that could delay Fed action, a key insight for market timing.
05:39Walsh's crisis background
Uses a person's resume to predict policy behavior, a novel analytical angle.
08:04Bitcoin's two-phase reaction
Provides a clear framework for how Bitcoin might behave in a crisis, with historical precedent.
10:42[00:00] In its recent rate decision, the Fed held rates for the fifth meeting in a row and three officials voted to hike. The first unified hawkish triple descent in nearly a decade and the new Fed chair Kevin Walsh stood at the podium and said, "I asked for a good family fight and I got one." Now,
[00:17] everyone is reading that as strength, but there's a good reason, which I'll explain in this video, to believe it's precisely the opposite. That blend of a confident committee, hawkish descents, and long patient hold. Well, we've seen that before. In June of 2007, the Fed had been parked at 5.25%
[00:35] for 15 straight months and sounded every bit as sure of itself. 10 weeks later, it cut by 50 basis points in a panic. Fast forward to today, and well, cracks are visible in financial markets, and Bitcoin is the single most sensitive asset to what happens next. So, in this video, we're going to
[00:52] walk through the historical pattern that says this pause might already be over. the signs of market weakness that tell us we're at a turning point and when BTC could be kicked into a whole other gear. My name is DC and you're watching the Coin Bureau. So, let's begin by looking at a historical
[01:09] pattern that gives us some insight into where we are today. Across every tightening cycle in recent decades, 1984, 1989, 1995, 2000, 2006, 2018, the median gap between the final hike and the first
[01:24] cut is roughly 7 and 1/2 months. But there's something interesting about this gap. Hawkish resolve at the top of a cycle isn't a signal of strength. It's a lagging indicator. committee's anchor on the inflation they can already see in the data which is by definition the past while the
[01:40] actual economy rots underneath them. The 2006 to 2007 sequence walked this exact path step by step. There was a longhold at the top. Committee members grumbling about inflation risk and then a sudden
[01:54] 50 basis point cut on the 18th of September 2007. The moment credit started cracking because when the Fed turns it doesn't turn gently. In a normal easing cycle, you get around 235 basis points of
[02:06] cuts in the first 12 months. In an emergency one, up to 400, and that's a huge difference. The Fed eases all at once, and it does it after leading you to believe that it wouldn't. So, that's the pattern. If you're suspicious about it, because that alone is just a narrative, we have to
[02:22] look at some key features of today's market that spell trouble. On the 27th of July, the 5-year credit default swap on Nvidia hit an all-time high of 82 basis points. Now, for anyone unfamiliar,
[02:34] a credit default swap is just insurance against a company failing to pay its debts. The higher the price, the more the market thinks something's wrong, and Nvidia is a $4.6 trillion company. This
[02:46] is the most profitable business in the world, and professional investors are paying record prices to ensure against it defaulting. Now, that number jumped 14 basis points in a single session. The biggest one-day move since the contract started actively trading. Why? Well, because Nvidia has
[03:02] been reportedly discussing over $750 billion in AI infrastructure commitments, including a potential $250 billion financing guarantee for an OpenAI data center campus in Ohio. And NVIDIA's filings
[03:15] disclose a maximum exposure of $3.5 billion across all its facility lease guarantees. $3.5 billion on the books and a reported back stop roughly 71 times larger than that. So, you can see why the
[03:30] credit markets are getting a little sensitive. But it isn't just Nvidia. Oracle's default protection is sitting above 200 basis points because of growing credit risk concerns. Metas at 93, Alphabets at 65, Amazon widen tool core is at 855 basis points which implies roughly a 50%
[03:49] chance of default within 5 years. As Dylan Woo at Pepperstone put it, the credit market is noticing something the equity market hasn't fully priced. But there's even more. Private credit default rates hit a record 6% earlier this year. That's the largely unregulated, lightly reported channel
[04:06] that swallowed almost everything the bank stopped lending after 2008. US commercial bankruptcy filings are up about 13% year-over-year according to first half data. Small business chapter 11 filings jumped 50% in the first half of this year. And large corporate bankruptcies hit 372 in the
[04:24] first half, the highest first half total since 2010. And meanwhile, hyperscalers issued about $244 billion in bonds through mid July, more than double the 108 billion they raised in all of 2025.
[04:37] The AI buildout is now depth funded, and that depth is being repriced in a big way. Investor coverage on those bond deals collapsed from around five times in February to under two times by July. That's a massive spread and we're only in the early innings. Keeping track of credit spreads,
[04:54] bond auctions, and the Fed while also having an actual life is basically impossible for any one person. So, we made it a lot easier for you. Right here on YouTube, you can join the Coin Bureau Club light plan for just 10 bucks a month. You get daily market updates across both crypto and
[05:08] traditional finance. our dedicated teams read on the most important market details and none of the noise. Just tap the join button below this video to get started. Okay, back to the Fed because if
[05:20] credit is already showing signs of stress, the obvious question is why the Fed hasn't reacted. And the answer can be boiled down to one number. The June jobs report came in at 57,000 payrolls against expectations of around 115,000. On top of this miss, 74,000 jobs were revised away from
[05:39] the previous two months. Weekly private hiring is down roughly 60% since May. And yet, despite all of this, the unemployment rate went down from 4.3% to 4.2%. How is that even possible? Well,
[05:52] because roughly 720,000 people simply left the labor force. Participation fell.3 percentage points to 61.5%, which is the lowest since March 2021. Household survey employment dropped by
[06:05] 57,000. And this is what economists call low hire, low fire. That means nobody's getting hired, but nobody's getting fired either. So people give up looking and drop out of the statistics entirely. And when you drop out, you're not unemployed anymore. You're just gone. So the single number
[06:21] that would force the Fed's hand is being flattered by a shrinking workforce. And that is the delay to consider when you're trying to figure out the state of the market today. Fed chair Walsh himself described the labor market as steady back in June right before that print landed. But delays like
[06:37] this one don't get resolved gradually. They're usually resolved very sharply. Now at this stage you can probably imagine the big objection to this thesis. Inflation is still a problem. The Fed couldn't possibly cut here. There's a reasonable argument there and Walsh could
[06:51] not have been clearer when he said there is no soft inflation target. There's only a target and it's 2%. But there's something else to consider. The Fed does not need to cut rates to flood the system with liquidity. Financial stability is a completely separate lever from interest rate
[07:06] policy, and one could easily argue the plumbing is starting to look thin. The reverse repo facility, which is basically the Fed's spare cash cushion, has drained from a peak of around $2.5 trillion to
[07:19] effectively nothing. One reading put it at 376 million. Bank reserves sit near $3.1 trillion, scraping the bottom of what the Fed calls ample and quantitative tightening only ended in
[07:31] December. The Fed has already been buying Treasury bills since January just to keep reserves topped up. And consider the language change in the Fed's most recent statement. They shifted to saying they are continuing their policy of maintaining ample reserves. There is no shock absorber left in this
[07:48] bank. Kevin Walsh was confirmed back in May this year. He served on the Federal Reserve Board from 2006 to 2011, which means his actual resume is 2008. He was the board's crisis operator involved
[08:04] in designing and running the emergency liquidity facilities, the team auction facility, the commercial paper funding facility, the things that kept the funding markets breathing when everything else froze. That is his formative experience. So his view on markets was largely forged by the
[08:20] events of the global financial crisis. And right now he's running a full anti-inflation credibility play. And he's running it very well. But if you're asking who on that committee is most likely to open the taps the second funding market sees up, it's the guy who built the taps. Now, of course,
[08:35] he hasn't come out and said that himself. He actually said the Fed is not in the bailout business. But any central banker would say the same thing. Resume tend to predict behavior a lot better than press conferences do. So if we roll with this thesis, when does this actually happen?
[08:50] Of course, nobody can predict these things down to the day, but there are actually a few dates you want to circle big in your calendar. First, Jackson Hall, the 27th to 29th of August. That's Worsh's first keynote as chair. And he says the speech is still a blank piece
[09:06] of paper. But at the same time, he's running five internal task forces on communications, the balance sheet, the data, productivity, and the inflation framework. So to put it simply, a brand new chair with a blank page and five task forces is not a man planning to say nothing. Then
[09:22] we have another big pressure point. September 15th is the corporate tax date. Companies pay their quarterly taxes. The money drains out of the banking system into the treasury's account. Reserves fall, the repo markets tighten. And the FOMC meets on September 16th, just one day later,
[09:39] with fresh projections. So you have liquidity getting squeezed on a Tuesday. and the committee sitting down on the Wednesday. So, here are three things you want to watch between now and then. First, a sharply negative payroll sprint. Second, sustained friction in repo markets. And third,
[09:57] a default cascade in private credit. Any one of those and everything changes. What if you could trade real US stocks like Apple, Nvidia, or Tesla without leaving your crypto account? Well,
[10:11] that's the idea behind our tokens from BitGet. These are tokenized stocks backed onetoone by real shares. But the key difference is they are actually usable. You can trade them, use
[10:24] them as margin, and even earn dividends instead of just letting them sit in your wallet. So, if you want to check them out for yourself, sign up for BitGet using the link in the description or by scanning this QR code. Okay, so with all of that in mind, how does this impact Bitcoin? If
[10:42] you're holding Bitcoin and you're expecting this to be a straight line up, let's remain calm and just consider how this would play out. Phase one is likely ugly. As you've probably heard before, when everything breaks, correlations go to one. Everything sells at once. Margin calls come in
[10:57] and they force people to liquidate whatever they can actually sell. And remember, Bitcoin trades 24 hours a day. So, Bitcoin often gets sold first. In March 2020, Bitcoin fell roughly 50% from
[11:09] around $8,000 to under 4,000. Investors dumped Bitcoin, stocks, and gold simultaneously just to raise dollars. Now, phase two, that's where the fun begins. Bitcoin reclaimed its all-time
[11:22] high by November of that same year and then outran both the S&P and gold for the following two years. And the turn often comes before the actual rate cut across September 2019, March 2020, and March 2023. front-end futures repriced over 100 basis points of cuts within days to weeks of
[11:40] the break becoming visible. Bitcoin is already pricing in the probability of the response and it reprices harder than anything else because it has no earnings to impair, no customers to lose, and no cash flows to discounts. The only variable is that USD denominator. Michael Howell at
[11:58] Crossber Capital estimates Bitcoin's sensitivity to global liquidity at around 9.5 times. So, the whole move happens fast, super fast, which is exactly why most people get shaken out on the road to being right. Just look at how positioned this market is for the wrong sequence. Spot
[12:14] Bitcoin ETFs just had their first negative half year ever with $5.4 billion of net outflows, and June alone was the worst month on record at around $4.5 billion out. futures open interest
[12:26] climbed to a 2-month high near $47 billion and 700 million got liquidated in a single day on the 28th of July. $536 million of that loss. Retail is still net long about 63%. Options traders have
[12:42] shed their downside hedges. But in contrast to futures traders and ETF holders, long-term Bitcoin holders now control a record 16.64 million coins. That's about 83% of the entire supply. and they've
[12:54] been adding 50 to 100,000 per month, which is the strongest accumulation in 6 years. Now, we can't finish here without looking at one more thing that could in theory changed this whole outlook,
[13:07] and that's the bond market. Right after the Fed's latest rate decision, the 30-year Treasury yield reached 5.2%, its highest level since 2007, and it was rising even as the front end began pricing
[13:20] in cuts. So, the term premium, which is basically just the extra return investors want for locking up their money for longer, has climbed back into positive territory after years below zero. And we've already seen this fail once after the Fed's 50 basis point cut in September 2024.
[13:37] The 10-year yield went up from around 3.65% to 4.79% by January. If term premium keeps climbing while the Fed eases, then financial collisions never actually loosen. The liquidity impulse gets
[13:50] absorbed by the bond market before it ever reaches risk assets. So that's one big thing to keep in mind. That scenario could invalidate all of this. Therefore, it's a good idea to keep watching the 30-year. If it keeps going up while the Fed cuts, we're in an entirely different market territory.
[14:06] Okay, so let's do a quick recap. Everyone is looking at the three hawkish descents as a central bank taking control. But if you look at history, it's very often the last position a committee takes before the data forces its hand. Over the last few years, Bitcoin was mocked as a failed
[14:23] inflation hedge, while gold got the headlines. Except gold's down 6.5% this year, too. So, that story didn't work out for anyone. Bitcoin has always functioned as a liquidity instrument. And liquidity comes back the second something in credit gives way, which is what record Nvidia
[14:39] default protection, 6% private credit defaults, and the highest bankruptcy count since 2010 are telling us. But what do you think? Do you think Bitcoin thrives when the liquidity tabs are turned on, or is this just wishful thinking? Please get highly opinionated in the comments and let us
[14:55] know. And if you want to understand how Bitcoin's price actually tracks global liquidity rather than the inflation narrative, then definitely check out our full breakdown right over here. As always,
[15:07] thanks so much for watching and I'll see you again very soon. This is DC signing off.




⚡ Saved you 0h 15m reading this? Transcribe any YouTube video for free — no signup needed.