
Why Most Traders Lose Money (Hint: Overanalysis)
43sExposes a common, relatable beginner mistake that instantly grabs traders' attention.
▶ Play Clip"Title promises a real framework and mostly delivers, but the final third is a course pitch."
This trading tutorial argues that most traders lose money because they constantly analyze the market instead of focusing on a few high-probability value areas. The speaker explains that 99% of market movement is chaos, then shows two simple value zones — the first five-minute candle and yesterday's high/low — along with concrete entry setups.
Beginners believe the more you analyze the market, the more you earn, but this is an illusion. Most traders lose because they over-analyze or trade randomly.
Strategies keep getting more complicated — indicators, price action, volume, smart money — but cognitive bias makes complex ideas seem more effective than they actually are.
The speaker, citing math and statistics, says 99% of market movements are random and unanalyzable; a chart is just a history of quotes.
Large funds entering or exiting the market create supply and demand imbalances. These rare moments of structure are the only places worth trading.
At a value zone, wait for clear conditions: compression with tails followed by an impulse, a breakout followed by a pullback reversal, or acceleration with high volume before a reversal.
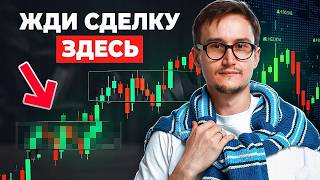
On the Moscow Exchange, mark the high and low of the first five-minute candle at 10:00 MSK. This candle carries the highest volume and its boundaries act as key levels.
Yesterday's extremes work across Forex, stocks, crypto, and the Moscow Exchange. Price below yesterday's low signals bearishness; above yesterday's high signals bullishness.
After a breakout of yesterday's low that moves far from the level, wait for a reversal in the middle of the breakout wave, set a stop beyond the model, and target twice the risk.
The path to more stable trading is not more analysis but fewer, well-defined value areas where big capital must act. The video closes by pitching the author's structured course for beginners.
What percentage of market movements does the speaker describe as chaos?
99%
02:31
What is the main mistake beginners make according to the speaker?
They think a trader should constantly analyze the market, but endless analysis is an illusion and leads to losses.
00:16
What is the first value area mentioned?
The high and low of the first five-minute candle at 10:00 Moscow time on the Moscow Exchange.
08:04
Why is the first five-minute candle significant?
Because it contains the maximum amount of volume.
08:20
What is the second value area?
Yesterday's minimum and maximum, which work on Forex, stock markets, cryptocurrencies, and the Moscow Exchange.
10:09
How do you determine a bearish or bullish trend using yesterday's levels?
If price goes below yesterday's low, the trend is bearish; if it goes above yesterday's high, the trend is bullish.
10:24
What does the speaker recommend for people who work and cannot watch the market all day?
Set yesterday's high and low boundaries, set alerts on them, and return only when something happens near those levels.
10:50
What should you do when price breaks below yesterday's low and continues far from the level?
Look for a rebound trade, wait for a reversal, and enter near the middle of the breakout wave.
11:28
What is the risk-reward ratio used in the speaker's examples?
Take profit is twice as large as the stop loss (2x risk).
09:04
What course does the speaker promote for learning trading?
Grail of Real Trading 3.0.
13:44
99% of market moves are chaos
This reframes trading from predicting every candle to waiting for the rare 1% of moves that matter.
02:31Big capital creates the only tradable structure
Explains why supply/demand imbalances from large positions are the foundation of value areas.
03:42If-then logic at value zones
Gives beginners a concrete conditional checklist instead of vague 'feel' for the market.
06:34First five-minute candle as a level
A simple, time-specific way to define high-volume levels on the Moscow Exchange.
08:04Yesterday's high/low for busy traders
Shows how to trade medium-term without monitoring the screen, using alerts and predefined levels.
10:09[00:02] deals, you only need to concentrate in a few places. Most beginners make a big mistake. I've been through it myself. When I first started trading 18 years ago, it seemed to me that a trader
[00:16] should constantly analyze the market. And the more you analyze it, the more trading opportunities there are, the more you earn. In fact, this is a deception and an illusion. In this video, you'll learn where to
[00:29] focus to maximize your earnings. In order for us to understand how to make money, we first need to understand how not to do it. You all know that most traders lose money and we need to do things differently than
[00:46] most. As for the majority of things, I'm an expert here most people operate, because I have an online school on the topic of trading, and I have my own online school on the topic of trading, and I have my own experience since 2008, and I have
[01:00] been blogging about trading since 2012. That is, I see who writes what and who does what. So I understand perfectly well what people want. They want to do endless market analysis. Each subsequent trading idea, trading concept,
[01:13] strategy that is published on the Internet is more complex than the previous one. That is, before we had trading based on indicators, then on pressure action, then there was volume analysis, and now there is the concept of smartmania, which no one really understands. It's getting more and more complicated
[01:25] Because cognitive biases work in such a way that complex things seem more workable, although this is not the case at all. That is, this is the first side of the issue, when people endlessly analyze the market, every candle, every
[01:38] line, where it went, what will happen next, and so on. Endless analysis. The other side of this coin is when people happen to be random . That is, some news came out , they analyzed the market, and no one
[01:50] cares what will happen next. That is, literally from time to time. Moreover, these cases are always momentary in nature. This is either due to some kind of crazy growth, or a crazy fall, or some kind of news. I used to run webinars with
[02:04] market analysis, that is, people would send in the names of coins and so on. I analyzed it. And they always sent coins that were on hype. These are the ones you can hear. Someone wrote something there, they always sent them, because people
[02:16] want to analyze the market at the moment when they hear something about it. That is, from time to time, a different strategy leads people to losses. This is a 100% fact. What is true is that 99% of market movements are
[02:31] chaos. This is a Bronze movement that defies any analysis. You can say whatever you want, bring up whatever concepts you want. I know math, I know statistics, I know numbers, I know that 99% of market movements are just
[02:45] chaos. The graph you see on the screen is just a legend. This is a history of quotes, nothing more. How to make money then? Well, because we have make money then? Well, because we have 1% that creates the direction of this
[02:59] very chaos. 1% is when large capital enters the market. Imagine an ordinary vegetable market. And a huge truck arrives at this ordinary vegetable market , which needs to sell, for example, 10 tons of apples. Of course, she
[03:13] will dump the price. Supply becomes greater, demand becomes less, or it remains the same. Our price is falling. The same thing happens on the stock exchange. falling. The same thing happens on the stock exchange. If a large fund enters the market, the
[03:26] capital itself begins to influence the market, because an imbalance in supply and demand arises. It doesn't matter what it is, big player entries, exits, rebalancing. The very fact that this position is large has an
[03:42] impact on the market. So, this 1% appears in places of value and in places of imbalance. Points of imbalance are when something changes in a market participant's portfolio and he is forced to rebalance there. Roughly speaking, he has a
[03:56] large position, 50% in stocks, 50% in bonds, for example. And his bonds fell in price. Now he has, for example, 60% shares and 40% bonds. To maintain the proportion, he sells part of the shares and buys bonds.
[04:11] We cannot know these distortions in advance, so we can concentrate on 1% of them. That is, places of value, places where participants make trading decisions en masse , where participants monitor the chart, and where participants will place
[04:24] the chart, and where participants will place their positions. This is where a lot of demand or supply will appear. This is where the structure will appear and the capital will appear. is, put the places of value on the
[04:37] graph, you will notice that your life has become much easier. Why? Because, entry points when you are engaged in endless analysis. Well, of course, It will seem that the market is, for example, overbought or, for example, oversold.
[04:53] You will want to make a trade and it will most likely be a mistake. Once you have clear spots in the market where you analyze the market, you no longer need to endlessly search for an entry point. You know perfectly well where you will
[05:08] look for it. You don't have to constantly analyze the market, which means you'll have fewer false entry points. The most important factor is psychological. You will have less anxiety, that is, you will not be so worried about whether to make a
[05:22] deal now or not, whether to wait or not. You will have specific places where you will focus your full attention. You will have fewer doubts and the important moment will require much less
[05:35] time. We work on markets in addition to our regular work. That is, we are engaged in markets. That is, if you, for example, are my age, I’m 37, you probably understand me perfectly. A lot of things to do , a lot of worries, children, not children, cats
[05:51] there, a permanent family. All this requires attention. Yes, and I just want to sit there in the evening or drink beer or watch some TV series. I watch some TV series. I
[06:04] analyze the market. And here you have specific places where you just need to focus. It will take literally a little time. You don't need to constantly analyze the market. You simply set an alert instead of a value and
[06:19] no longer monitor the chart. I will tell you about these places of value a little further. For now, we'll talk about what you should be looking for in these very places of value. And here you can connect the logic, if then, that is, if you see this, then this will happen
[06:34] . So we have a place of value. Let's display its lines. If the market approaches this very line and begins to contract, then the amplitude of the candles becomes small. And if tails appear on the candles here, and
[06:49] after that there is a downward movement, a sharp impulse movement, then there will be a sharp impulse movement, then there will be a downward movement. If the market breaks through this area and breaks high enough, then we expect a pullback and here the appearance of a
[07:04] reversal situation, that is, small candles with a subsequent impulse, in my case upward or downward, if the example is mirrored, and there will be further upward movement. If the market is moving upwards, starting to accelerate, the amplitude of the candles
[07:20] becomes larger and larger, and this is accompanied by a large volume, then it is necessary to wait for a downward movement, the appearance of the first maximum for a bearish market, an example or minimum for a bullish market, and wait for a further downward movement.
[07:34] And your entry point will be right here, that's all. Three main entry points. Of course, there are about 12 of them, but we will focus on only my Telegram channel. You can scan this QR code and view
[07:51] it. There I post my transactions, as well as analyses of the current situation. Please scan and sign. I think that by this point I have already warmed you up enough to announce these very places of value. In general, there are
[08:04] talk about only two. The first place of value is the first five-minute candle. at 10:00 Moscow time on the Moscow Exchange. High and, that is, the maximum and minimum of this candle, will be our desired levels. Why the first candle?
[08:20] Because it has the maximum amount of volume. If you understand that , use a fifteen-minute candlestick instead of a five-minute one . The five-minute candle works well on currency futures. There is also a
[08:36] talk about it a little later. Here is an example of a trade from my real account. This is how much I earned from this deal. Here we have the opening of the market. The market opens at 10:00. The highs and lows of the first five-minute candle are
[08:51] significant levels. The market approaches this area, begins to accelerate, a lot of volume appears, and a downward movement occurs. Here is the entry point into a short with a clear stop order, with a small take profit and twice as much. The market
[09:04] reverses. Then this situation repeated itself here, but here I no longer made a deal. In the same way, the market moves towards this area, compresses its range, impulse move down, and in the same way the move down occurs.
[09:19] Another example from a real account. Here we have the maximum of a five-minute candle and the minimum of a five-minute candle. The market is approaching the upper limit. It was possible to enter right here, but there was no way to monitor the terminal. I
[09:31] came in a little later. That is, I came in here . A clearly understandable situation. That is, our market is moving upward. Here we have an example of compression followed by a downward impulse. That is, it was possible to enter directly on this candle with a very short
[09:43] stop order and a clear take profit. The market caught my take profit, and I came out with a small, but nevertheless plus profit. Please note that in this case the strategy is more of a scalping one, meaning we are using very, very small
[09:57] timeframes. On the five-minute chart, I set the maximum and minimum, and I looked for a specific entry point on the minute chart. And this is a perfect example. This is how it should be done. The next place of values is the minimum and maximum of yesterday. Moreover, it
[10:10] doesn’t matter where you trade, be it the Forex market, the stock market, cryptocurrencies, or the Moscow Exchange. This will work everywhere. Yesterday's highs and lows are observed from major participants. If the price goes below
[10:24] yesterday's low, you are in a bearish trend. If it is above yesterday's high, then it is in a bullish trend. To be honest, I like this trading method more than the first five-minute candle, because the
[10:37] first five-minute candle still implies short-term trading, super-short-term trading. This method is more of a medium-term one, where you can make a trade and hold it there for several hours and perhaps
[10:50] even hold it until the end of the trading session. This is an ideal way if you are a working person. That is, you need to, in essence, set the boundaries of yesterday's trading day, that is, set the minimum and maximum of yesterday,
[11:02] set an alert on them and then simply not watch the market. Return only when something happens near these levels. Here is another example. I showed this deal on my Telegram channel. You can scan the
[11:15] QR code and view it. What you see here is the level - this is yesterday's minimum . we are experiencing a breakout of this minimum. Moreover, the market stops far from this level. That is, if the market stopped here, I would, for example,
[11:28] look for an entry point, on the contrary, to buy. And here the movement is happening much lower. Aim for the middle. Here you have a breakout wave, and the middle of the breakout wave is below the level. This means we need to look for a rebound trade,
[11:41] that is, wait for a reversal and look for an entry point somewhere around here. Well, that's basically what I did. Then we have a movement to this very level, the range is compressed and the candles begin to move in the opposite
[11:55] direction. A small rounding like this appears. This is where I enter the position. Of course, I set the stop behind this model approximately here, and the take profit is twice as large, that is, here. And here is the result. After some
[12:09] time, the market clearly reached my goal, it brought me so much money. I understand monitoring the market, but lately I prefer to set stop-loss, take-profit and just not monitor it, because I have a bunch of other
[12:23] processes. That is, I myself am also involved in business, in addition to the fact that I am involved in the investing and trading, and I need to film content, including a bunch of operational activities. And, of course, there is not always time to
[12:37] trade so actively. So I set a take profit, set a stop loss, and the market itself essentially makes me money. I love this business, of course . The videos that I release on my channel, of course, contain
[12:50] information more for beginners, for the very first timer. If you want timer. If you want to understand it more and want to find your own want to start earning money with it, not necessarily instead of work, but
[13:04] alongside your main job, this method will allow you to increase your wealth and multiply it. And most importantly, if you do as I tell you, it will essentially allow you not to lose money. That is, the
[13:18] majority of people who come to the market lose money. And they lose because they simply don't understand the basic principles. I covered these basic principles in my training. Please scan the QR code and
[13:31] review it. Our school provides a foundation for any financial topic, from how to build investment portfolios to scalping and highly speculative entry points. Since you are watching
[13:44] this trading content, you are of course interested in trading. I recommend you take a look at the Grail of Real Trading 3.0 course. This training is, of course, free, because the cost of this training is, to put it mildly, very
[13:58] affordable. That is, if you look at my competitors, where there are hundreds of thousands and so on, then here for very little money you acquire a huge base. We are now inside this very base. Please
[14:10] note, there are chapters here, there are lessons here. This course he teaches from the smallest to the largest, and has an incredible structure. You don't need to piece everything together , consult with someone, study the GPT chat, and so on. Everything
[14:24] in one place. You bought it once, concentrated and started earning from less to more. And here, not only is it from least to greatest, but each lesson literally lasts 10, 15, 20 minutes. We targeted
[14:41] came after work and wanted to learn about the markets. So, you watched one or two lessons, made notes, it will take you literally half an hour, and started day they repeated it again, repeated it again, repeated it again. And so,
[14:56] without even noticing it, literally in a week you already know this entire base, you know exactly what needs to be done. Your head becomes clearer and you understand what you need to do. There is no chaos, no water. Put
[15:09] pluses, circles, webinars for an hour and a half . Moreover, we even removed pauses in speech in every lesson, that is, when I speak and then fall silent, thinking about something, we even removed these pauses. Save, [ __ ], everything is deleted. Maximum concentration
[15:23] of knowledge, everything is structured. Scan the QR code, write trading systems and start earning. The same as me, the same as my students. You can scan and study reviews on the independent review site infit to decide
[15:37] whether you should buy it or not. I recommend, of course, to buy, because we, I wanted to say, we are one of the best. We are generally the best at the moment. We are really handsome. I wish you good luck. Earn happily.



⚡ Saved you 0h 15m reading this? Transcribe any YouTube video for free — no signup needed.