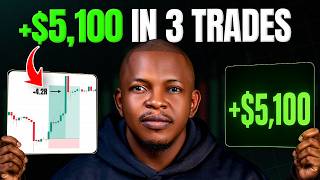

They Said 1-Minute Charts Liquidate My Capital
44sDirectly addresses a critical comment, creating a compelling narrative of proving doubters wrong with immediate results.
▶ Play Clip"The title promises results and delivers them, but the actual strategy is a common price action approach, not a revolutionary secret."
The video demonstrates a trading strategy that uses higher time frame structure for direction and lower time frames for entry, refuting the claim that 1-minute charts are inherently risky. The creator breaks down three winning trades (two swing, one day trade) on Solana and Ethereum, emphasizing the importance of structure and confirmation.
After a comment claiming the strategy would lose money, the creator took three consecutive winning trades using the same model, each with a risk-reward ratio of at least 1:3.
The 1-minute chart is not for finding direction but for taking entries. For swing trades, use the 1-hour chart for structure and 5-minute for entry; for day trades, use 15-minute for structure and 1-minute for entry.
On the 1-hour Ethereum chart, a break of structure and change of character indicated a bearish move. The target was a supply zone, and the entry was confirmed on the 5-minute chart with a Fibonacci retracement, ensuring a 3R risk-reward.
At the area of interest, a short position was taken on Ethereum after a change of character on the 5-minute chart. The stop loss was placed at the high, and the take profit at the low, with the risk-reward adjusted to 3R.
This trade used Ethereum's 15-minute structure to confirm a Solana entry on the 1-minute chart. A change of character in the supply zone led to a short position, targeting a low, and the trade hit take profit within 2 hours 24 minutes.
Three trades were taken with risk-reward ratios of 3R, 3R, and 4.2R. The key takeaway is that the 1-minute chart is not the problem; using it without higher time frame structure is.
The strategy's success lies in combining higher time frame structure with lower time frame confirmation, ensuring high risk-reward trades. The creator emphasizes that the 1-minute chart is only a trigger, not the strategy itself.
What is the role of the 1-minute chart in this trading strategy?
It is used for entry, not for finding direction.
00:44
What time frame is used for structure in swing trades?
The 1-hour chart.
01:00
What is the minimum risk-reward ratio the creator aims for?
At least 3:1.
05:52
What is a 'change of character' (CHoCH) in price action?
A signal that the direction is changing, often marked by a break of structure.
02:45
How did the creator confirm the Solana day trade entry?
By using Ethereum's 15-minute structure and a change of character on the 1-minute chart.
08:39
What was the risk-reward ratio of the third trade?
4.2R.
10:41
Lower Time Frames Are Triggers, Not Strategy
Clarifies a common misconception that lower time frames are inherently risky, emphasizing the importance of higher time frame context.
00:44Using Ethereum to Confirm Solana Entry
Shows a cross-asset confirmation technique that can improve trade accuracy.
01:47Three Trades with 3R+ Risk-Reward
Demonstrates consistent profitability with a structured approach, countering the criticism that the strategy loses money.
10:41[00:02] will lose money [music] in the end. This was a comment I got under one of my videos. And the funny thing is that after that comment, I took three consecutive winning trades using the same model, Solana, Ethereum, and Solana
[00:18] again. All three trades won. But more importantly, each trade gave me more importantly, each trade gave me more than 1:3 risk-reward. Now, mind you, I'm not showing you these to say every trade will win.
[00:31] That is not how trading works. What I want to show you is something more >> [music] >> This strategy did not just help me catch these three winning trades. It also helped me avoid many bad trades that
[00:44] >> [music] >> many traders see the 1-minute entry and they immediately think it is gambling, but they miss the full setup. The 1-minute [music] chart is not where I find direction. The 1-minute chart is
[01:00] where I take the entry. [music] Let me simplify it. For swing trades, I use the 1-hour chart for structure and the 5-minute for entry. For day trades, I use the 15-minute chart for structure and the 1-minute for entry.
[01:16] The lower time frame is not the strategy. It is just the trigger. So, in this [music] video, I'm going to break down the setup, the entry, the stop loss, and the exit of the three trades. The first two are swing trades.
[01:33] The last one is a day trade. And the last trade is where it gets more interesting because I used Ethereum to confirm a Solana entry. That small detail alone can change how you look at trades. Let's start with the Solana
[01:47] trade. Now, I took the first trade on Solana, but I started this analysis with Ethereum. So, let's start from there. This is a 1-hour Ethereum chart, and you trending up. We had a break of structure over here.
[02:02] Then price, you know, came down, retrace to this low, then came up again, and we have another break of structure here. So, it is expected that
[02:17] if we're going to keep moving up, we should expect price to should expect price to come low to around this area again. This is what we're going to be expecting. So, in this price movement,
[02:31] we are seeing price action here suggesting that price should go down. Let me explain it. Over here, we had a break of structure,
[02:45] character, meaning the direction is changing to the downside. We then had a break of structure We then had another break of structure here.
[03:02] Then price went up again retracement. It didn't take out this high. So, therefore, we should expect another break of structure taking out this particular low. So, this is the target, this line
[03:16] here is is a target. [music] Now, let's now look into the price action internal price action of this. If you look at here, internally as well, [music] and this now led to a change of
[03:30] and this now led to a change of character at [music] this point. Okay? So, break of structure here, change of character here. Then we had a retracement. So, this movement downward, [music]
[03:42] and we have another break of structure here. retracement [music] retracement [music] here.
[03:54] Retracements. Another break of structure here. expect a retracement this way and price moved [music] lower. This is just the setup. And we can see we
[04:08] studied the structure on the 1-hour time frame. Now, to mark out where price will likely retrace to before taking an entry, we have to identify the areas of interest. In this case, I'm using the
[04:23] supply zone. I'm actually on the 1-hour, but I'm using the 2-hour supply zone, which is this. Okay. So, this is my supply zone here. So, I expect price to move all the way to [music] this
[04:36] and do this. So, therefore, a trade in this region. I should go down to the here. But, what I did now is while waiting for
[04:50] I decided to look for an entry in this particular region to trade it up to this um region. This is my area of interest. So, to do that, it's also very simple. I move down to
[05:05] the 5-minute time frame. And before that, so if you go to Solana, this [music] is the same setup we have on Solana. So, back to Ethereum. To enter this trade now, I'm going to go down to the 5-minute time frame and look
[05:20] videos, my entries are simple. Look for the same change of character in the lower time frame. So, in the lower time frame, here is an internal break of structure. Okay? So, once we have this,
[05:37] this high taken out, this becomes my this becomes my internal change of character. what I want to do now is simply put my Fibonacci from here
[05:52] and take this trade to this top. So, it is simply this way. Take a long position from here. Make sure the risk-reward ratio is at least three. So, up to this point is 2.9.
[06:05] And I take it I took it lower just to make it three. took. [music] The one I took is this particular one. So, we're going to go Solana on the 5-minutes time frame.
[06:17] So, the same thing here. We have a breaker structure here. Then here is the change of character.
[06:33] high. once I have a 3x, [music] you can see here risk-reward ratio is I'm okay with this very trade. And this just played out very nicely
[06:47] and hit a profit. If I taken the same trade on Ethereum, you also see the same thing happened. Um this trade played out nicely. Once we tapped in, and we went straight. So, price tapped
[07:01] in and went nicely straight [music] to take profit. So, this is the first trade the stop loss, and the take profit is the same thing as you can see on the P&L. Now, the second trade is Ethereum like So, now we are here and like I
[07:16] said, so we are now in the area of interest. This is the original point I was looking at to take a short position um on Ethereum from. So, since we're here, all I have to do is to look for a confirmation entry in
[07:29] Well, my target original target is this. high, this [music] is my very um first target.
[07:41] So, still on the 5 minutes, we're going to go ahead and look for a confirmation entry. So, that's just came here. Look at this. and an internal change of character here.
[07:56] This just gives the signal that we that [music] the price is going to go lower. The way I do this is simple. Take a short position to from this region. short position to from this region. Target is stop loss at the high
[08:09] and take profits at that low. Then, the only thing I do, this is 2.25. I need it to be three. You move it up till you get [music] at least a three. This becomes a trade. So, price took it nicely and [music]
[08:25] and went straight to take profit. So, on the screen you can see the P&L, the exact entry and exit for this particular trade. So, this is a second trade on trade, which was the Solana day trade this
[08:39] time. And like I said, this trade came from Ethereum [music] because if you look at this internal structure here, we'll be having the same thing. Let me just remove this. Price is having break of structure here,
[08:52] retracement, break of structure again here. Then, what do I expect? A retracement and [music] break. I can target this region. I can target this very low.
[09:06] So, on the 15 [music] minutes, if it comes very clear that this is the supply zone to watch [music] out for, this particular supply zone. This is Ethereum trade. I can take this, but
[09:20] >> [music] >> If you go to the 1 minute, like I said, this is a day trade. On the 1 minute, all we have to do is look for a change of character in this region.
[09:33] [music] this very this very um high. change of character, which makes this trade a good trade to take. But, where I
[09:48] took this trade is on Solana because I saw the same thing here. So, these points gave me the change of character I saw on Ethereum. Then, this becomes the very low the target for
[10:02] this particular trade. And
[10:14] on this particular trade because of this [music] very big fair value gap here price actually tapping to close at this fair [music] value fair value gap. And you can see that this trade
[10:26] straight to the take profit, [music] giving me this P&L that you're seeing on the screen right now. And this whole trade took place within [music] 2 hours 24 minutes. So, this is it. Two swing
[10:41] trades and a day trade using this exact same [music] method. Structure on the higher time frame and confirmation on the lower time frame. Three trades, 3R, the lower time frame. Three trades, 3R, 3R, and 4.2R. So, the 1-minute chart is
[10:54] not the problem. The problem is using the 1-minute chart without higher time frame structure. By the time I drop down to the 1-minute time frame, I am not looking for direction anymore. I'm looking for the entry. Now, mind you,
[11:08] not everyone has the time to sit on the chart [music] and wait for this setup to form. That is why we are building Real traders take the entries and your account copies them based on your own risk per trade. If you want to join the
[11:21] waitlist, the link is in the description of this video. But, there is one part that we have not talked about yet. Sometimes, the setup is clean, [music] the confirmation appears,
[11:35] you take the entry, and the confirmation still fails. In this next video, I want to show you how I still get paid from trades like how I still get paid from trades like this.



⚡ Saved you 0h 11m reading this? Transcribe any YouTube video for free — no signup needed.