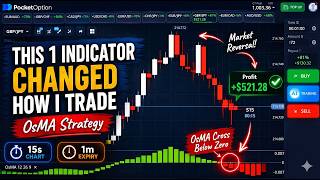

The 1 Indicator That Changed My Trading
45sHook promises a game-changing strategy, sparking curiosity and high click-through rates.
▶ Play Clip"The title promises a life-changing indicator, but the content is a straightforward strategy breakdown with realistic losses shown—solid but not revolutionary."
This video presents a rule-based trading strategy for binary options using the OsMA indicator on a 15-second chart. The strategy is designed to capture momentum in zigzag trending markets, with clear entry rules and a focus on discipline and consistency.
The OsMA strategy uses a single indicator with default settings (12, 26, 9) on a 15-second chart with a 1-minute expiry. The core concept is to trade based on OsMA crossing the zero line, confirmed by two bars and two candles.
For a buy, wait for OsMA bars to cross from below to above the zero line. Then, require two green bars above the line and two green candles on the price chart confirming the move. Only then enter the buy.
For a sell, wait for OsMA to cross from above to below the zero line. Require two red bars below the line and two red candles on the chart. Both conditions must be met before entering the sell.
Avoid trading when OsMA bars are flat near the zero line (no momentum) and during major news events (chaos breaks the strategy's math). Also, never trade against the trend; the strategy is designed to follow momentum.
A sell setup was identified with OsMA below zero, two red bars, and two red candles. The trade was placed but resulted in a loss as price moved against the position. The presenter emphasizes that losses are part of the process and discipline is key.
A buy setup was identified with OsMA crossing above zero, two green bars, and two green candles. The trade was placed but also resulted in a loss. The presenter highlights that no strategy wins every time and the edge is in consistent execution.
A sell setup was identified with OsMA crossing below zero, red bars, and red candles. The trade moved in the desired direction immediately and closed as a winner, recovering all previous losses. The presenter stresses that this was not planned but a result of following the rules.
The main takeaway is to follow your rules every time, stay patient after losses, and trust the process. The strategy works best in zigzag markets, and discipline is more important than any single trade.
The OsMA strategy is a simple, rule-based approach for trading binary options on short timeframes. Success depends on strict adherence to entry rules, avoiding no-trade conditions, and maintaining emotional discipline, especially after losses.
What are the default settings for the OsMA indicator in this strategy?
12, 26, and 9.
01:14
What timeframe and expiry are used in this strategy?
15-second chart with a 1-minute expiry.
01:14
What are the two conditions required for a buy entry?
OsMA crosses above the zero line, and there are two green bars above the line and two green candles on the price chart.
01:45
What are the two conditions required for a sell entry?
OsMA crosses below the zero line, and there are two red bars below the line and two red candles on the price chart.
02:12
When should you avoid trading according to this strategy?
When OsMA bars are flat near the zero line or during major news events.
02:29
What market condition is best for this strategy?
A zigzag trending market with clean swings up and down.
02:57
Rule-Based Entry
Provides a clear, objective entry criteria that removes emotional decision-making.
01:45Avoiding No-Trade Zones
Highlights the importance of market context and filtering out low-probability setups.
02:29Discipline Over Outcome
Emphasizes that long-term success comes from consistent rule-following, not individual trade results.
09:31[00:01] indicator, with just the right rules, can give you clean, clear signals on a can give you clean, clear signals on a 15-second chart? No confusion, no second-guessing. Today, I'm going to show you my Awesome A strategy. A
[00:14] simple, rule-based approach where you wait for the Awesome A to cross the zero line, confirm with two bars, confirm with two candles, and then you enter. That's it. No overcomplication, no noise. This strategy works best in a
[00:30] zigzag trending market. And I'm going to show you exactly how to spot it, read it, and trade it, step by step. If you're new here, subscribe to Sam Trading Strategies, because on this channel, we break down real strategies,
[00:45] real rules, and real charts. So, if that's what you're looking for, you're in the right place. Let's get into it. But real quick, before we dive in, trading binary options carries real risk, and capital loss is possible. I'm
[01:00] not promising results. I'm simply sharing what has worked for me in my own testing. Start on a demo account first, get comfortable, and only then go live. All right, let's get into the setup. We're using just one indicator, the
[01:14] Awesome A, with the classic settings, 12, 26, and 9. No custom tweaks, no fancy modifications. Keep it default. Timeframe is 15 seconds, and your expiry is 1 minute. Now, the Awesome A prints
[01:30] histogram bars above and below a zero line in the middle. And that zero line, that is the entire foundation of this strategy. Everything you're about to learn revolves around it. So, let's talk about the trading rules. And pay close
[01:45] attention here, because the entry is very specific. For a buy, you're watching for the Awesome A bars to travel from below the zero line to above it. That crossover tells you momentum is shifting to the upside, but we still
[01:57] don't enter yet. We wait. We need to see two green bars printed above the zero line and at the same time two green candles on the price chart confirming the same move. Both conditions together, only then do you enter the buy. For a
[02:12] sell, it's the exact mirror. OSMA crosses from above the zero line to below it. Wait for two red bars below the line and two red candles on the chart. Both confirm, then you enter the sell. Simple, consistent, rule-based.
[02:29] Now, here are two situations where you do not trade, no matter what. If the OSMA histogram bars are sitting perfectly flat near the zero line, stay out. There's no momentum, no direction, nothing to trade. And if a major news
[02:42] event just hit the market, stay out. News spikes break the math behind this worth trading through that kind of chaos. One more thing. Never trade against the trend. This strategy is designed to follow momentum, not fight
[02:57] it, and it performs best in a zigzag market where price is cleanly swinging up and down in waves. If the market looks flat, choppy, going sideways, just skip it. Wait for the zigzag. Wait for the trend. Then execute. Now, to make
[03:13] all of this second nature while you're actually trading, I've put together a free PDF guide for this exact strategy. It has the full details plus a quick reference entry card you can keep right next to your screen while you trade. The
[03:27] link is in the description below. Go grab it real quick so you can follow along with everything coming up next. All right. You now have everything you need. The indicator setup, the entry rules, and what to avoid. Now, it's time
[03:42] to actually see it in action. Let's pull up the live chart right now and go through real trades, entry by entry, bar by bar. Let's test this strategy live. Let's go. All right, we're live on the chart, 15-second time
[03:57] frame, and I'm watching this setup develop in real time. Look at the price action here. The market has been moving in a clear zigzag structure. We had a strong push up, then a pullback down, and now the Awesome A
[04:10] has crossed below the zero line. The histogram is printing red bars below the line, and the candles on the chart are confirming the same bearish momentum. Both conditions are lining up. Awesome A below zero, two red bars, two red
[04:24] candles. The rules say sell. So, I'm following the rules. Entry is confirmed. Expiry is set. Trade Entry is confirmed. Expiry is set. Trade is placed. Now we wait. And this, right
[04:37] here, is where trading gets real. The moment the trade is live, price does what markets love to do. It moves against you first. Look at this. A strong bullish candle suddenly fires up, pushing price away from our entry point.
[04:53] That's the market testing your patience, testing your discipline. And this is exactly why I always say, you don't manage the trade after you enter. You already did your job. The setup was valid. The rules were followed. The
[05:07] entry was clean. What happens next is the market's decision, not yours. So, what do you do in this moment? Nothing. You sit on your hands, you trust the structure, and you let the trade breathe. This is the hardest part
[05:21] of trading, not finding the entry, but having the discipline to stay calm while the trade is still open. And there it is. Trade closed. That's a loss. Now, let's keep watching the chart. The next setup is already forming. All
[05:37] right, same chart, new setup. And this time, the Awesome A is telling a completely different story. After that last trade, I kept watching, and look at swing down, found its footing, and now
[05:50] the Awesome A has crossed back above the zero line. The histogram is printing green bars above the line, and the candles on the chart are pushing upward confirming the same bullish momentum. The zigzag structure is still intact.
[06:02] The trend gave us a pullback, and now it looks like it wants to continue upward. Both conditions are met. Awesome A above zero, two green bars, two green candles. The rules say buy, so I'm following the rules. Entry confirmed, expiry set, buy
[06:18] trade is placed. Let's see how this one plays out. And just like that, the market does it again. The moment the buy trade goes live, that big bullish candle that triggered our entry, it stalls. And then price starts pulling back hard.
[06:33] A strong red candle forms, and the momentum that looked so clean just seconds ago completely flips direction. The price is now moving straight down against our buy position, and there's nothing we can do but watch it unfold.
[06:47] Now I want you to pay close attention to this moment, because this is where most traders make their biggest mistake. When a trade starts going the wrong way, the mind immediately goes to panic. You start questioning everything. Was the
[07:00] setup wrong? Did I miss something? Should I have waited longer? But here's the truth. No strategy in the world gives you a clean win every single time. What looks like a perfect setup on a 15-second chart can reverse in the
[07:14] very next candle. That's the nature of short-time frame trading. The edge is never in one trade. It's in how you execute consistently across many trades. So we stay calm. We let the clock run, and we accept whatever comes next. Trade
[07:28] closed. Another loss. Two back-to-back. Losses happen, even on valid setups, correctly. The worst thing you can do right now is panic, break your rules, or
[07:40] chase the next trade out of frustration. Document it, accept it, and move on with the same discipline. The chart is still moving. Let's keep watching. All right, new chart, fresh setup. And this one caught my attention immediately. Look at
[07:53] the price structure here. The market pushed up strongly, made a clean high, shifting. The Awesome A bars are starting to fall, crossing from above the zero line to below it. The histogram is printing red bars, and the candles on
[08:06] the chart are turning bearish, confirming the same downward pressure. talked about at the beginning of this video. The market went up. Now it wants to come down. And the Awesome A is telling us the same story. Both
[08:20] conditions are lined up. Awesome A crossing below zero, red bars printing, red candles confirming. The rules say sell, so I'm following the rules without hesitation. Sell trade placed. Expiry set. Now we let the market do its job.
[08:35] And from the very first second this trade is live, the market moves in our direction. No waiting, no uncertainty. Strong red candles pushing lower one after another. The Awesome A histogram is now firmly below the zero line, and
[08:49] the bearish momentum is accelerating. This is what a strategy looks like when everything aligns correctly. Structure right, Awesome A signal right, candle following through on what the chart
[09:03] already told us. Let's see where this closes. Trades closed, and all of them are winners. Every loss from this session recovered in one clean setup, session recovered in one clean setup, same strategy, same rules, same process.
[09:17] Now hear this clearly. I did not plan to recover those losses in one trade. I did not change my rules or increase position out of frustration. I simply waited for the next valid signal and followed the strategy exactly as taught. This
[09:31] everyone. What worked here could have easily gone the other way. The lesson from this entire session is simple. Follow your rules every single time, stay patient after losses, and trust the process. That is the Osma strategy in
[09:46] real market conditions. Raw, honest, and unfiltered. If you found this video helpful, make sure you subscribe to Sam Trading Strategies and hit the bell icon so you never miss our next strategy breakdown. The free PDF guide for this
[09:59] strategy is linked in the description below. Go grab it and keep it next to your screen while you practice. See you in the next one.




⚡ Saved you 0h 10m reading this? Transcribe any YouTube video for free — no signup needed.