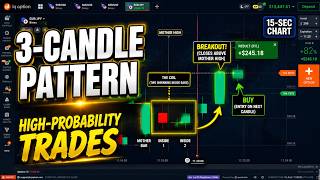

The 3-Candle Pattern Most Traders Miss
45sThe promise of a hidden, high-probability pattern with clear rules immediately hooks viewers looking for an edge.
▶ Play Clip"Delivers a solid, rule-based strategy with honest win/loss examples, but the 'high-probability' claim is unproven and the free PDF pitch adds a bit of fluff."
This video teaches a three-candle price action pattern called the 'double inside bar coil' for identifying high-probability trades on a 15-second chart. The strategy uses no indicators for the pattern itself, relying instead on a 50 EMA as a trend filter. The presenter explains the rules for both buy and sell setups, highlights common traps to avoid, and demonstrates the strategy with live market examples, including both winning and losing trades.
The video introduces a three-candle pattern called the 'double inside bar coil' that compresses market energy, leading to high-probability breakouts. The strategy uses zero indicators for the pattern itself, just pure candles.
The 'mother bar' is a large candle that defines a box (its high and low). An 'inside bar' fits completely within that box, wick to wick. Two inside bars in a row, each tighter than the last, form the 'coil', indicating pressure building.
Add a 50 EMA to the chart. Price above the 50 EMA means only look for buy setups; price below means only look for sell setups. This single rule filters out most bad trades.
For a buy: price above the 50 EMA, mother bar above the 50 EMA, and both inside bars completely inside the box. Wait for a candle to close above the mother bar's high (a wick doesn't count). Enter on the very next candle. Expiry is around four candles.
For a sell: price below the 50 EMA, same coil formation. Wait for a candle to close below the mother bar's low, then enter on the next candle. The inside bars' colors don't matter, only the range.
The coil can break in two directions. If it breaks against the trend (e.g., uptrend but breaks down), it's a trap and should be skipped. Only take trades that break in the direction of the trend as defined by the 50 EMA.
Even valid setups can fail when price breaks out and snaps back. The protection is to follow all four rules or take no trade. No filter removes failed breaks completely.
Price above the EMA, candles coiled, a candle closes above the setup, and a buy is taken on the next candle. Price pushes up and closes above the entry line, resulting in a win.
Another textbook buy setup. Price climbs above the EMA, coils near the top, breaks out, and the buy is placed on the next candle. Price breathes but stays above the entry line, closing in the green.
Two sell setups are taken simultaneously. One has a clean downtrend far from the EMA and wins. The other forms too close to the EMA, lacks fuel, and loses. The lesson: the further and cleaner the setup from the EMA, the stronger it tends to be.
The double inside bar coil is a simple, rule-based price action strategy that uses the 50 EMA as a trend filter to identify high-probability trades. The key to success is discipline: follow all four rules, avoid shakeout traps, and accept that even valid setups can fail.
What is the 'mother bar' in the double inside bar coil pattern?
The mother bar is a large candle that defines the box (its high and low) for the pattern.
00:44
What is an 'inside bar'?
An inside bar is a candle that fits completely inside the mother bar's box, wick to wick.
00:57
What is the 'coil' in this strategy?
The coil is two inside bars in a row, each tighter than the last, indicating pressure building.
01:12
What is the role of the 50 EMA in this strategy?
The 50 EMA acts as a trend filter: price above it means only look for buys; price below it means only look for sells.
01:12
What is the exact entry rule for a buy trade?
Wait for a candle to close above the mother bar's high (a wick doesn't count), then enter on the very next candle.
01:41
What is the expiry for a trade in this strategy?
The expiry is around four candles.
01:53
What is a 'shakeout trap'?
A shakeout trap is when the coil breaks against the trend (e.g., uptrend but breaks down). It should be skipped.
02:23
What is the key difference between a strong and a weak setup?
A strong setup forms far from the EMA with a clear trend behind it; a weak setup forms too close to the EMA without a clear trend.
07:30
The 50 EMA as a Trend Filter
This single rule is the core of the strategy's risk management, filtering out most bad trades.
01:12The Shakeout Trap
Understanding that a break against the trend is a warning, not a signal, is crucial for protecting your account.
02:23Failed Breaks Are Inevitable
Acknowledging that even valid setups fail and that strict rule adherence is the only protection is a realistic and valuable lesson.
03:05The Strength of a Setup Depends on Distance from EMA
The comparison of a winning and losing trade shows that setups further from the EMA with a clear trend are more likely to succeed.
07:30[00:02] coiling up like a spring, and most traders can't even see it. By the end of this video, you'll spot this exact three-candle pattern, you'll know the exact rules for buy trades and sell trades, and most importantly, you'll
[00:14] know which setups to completely avoid. Because in this strategy, the trades you skip protect your account just as much as the trades you take. And the best part? Zero indicators for the pattern itself. No settings, no lag, just pure
[00:29] candles. It's called the double inside bar coil. But before we start, one quick and important note. Trading carries a real risk of loss. Nothing in this video is financial advice, and there are no guaranteed results here. Everything I'm
[00:44] about to show you is for education only. So, always practice on a demo account first, and never risk money you can't afford to lose. All right, let's start from the very foundation. First, the foundation. This
[00:57] big candle is the mother bar. Draw two lines in your mind, its high and its low. That's the box. The next candle fits completely inside that box, wick to wick. That's an inside bar. The market pausing, compressing. One inside bar is
[01:12] common, but two in a row, each tighter than the last, that's the coil. Pressure building, and pressure always finds a way out. Now, before you look for any way out. Now, before you look for any trade, add a 50 EMA on your chart. That
[01:25] one line is your confirmation filter. Price above it, you only look for buys. Price below it, only sells. This single rule will save you from most bad trades in this strategy. The buy trade. Price above the 50 EMA, buy only mode. Mother
[01:41] above the 50 EMA, buy only mode. Mother bar, inside bar one, inside bar two. Both completely inside the box. Now, watch the mother bar's high. You need a candle to close above it. A wick poking through means nothing. There's the
[01:53] breakout, and your buy goes on the very next candle. Arrow always on the candle after the break, never the break itself. Expiry around four candles. The sell trade, perfect mirror. Price below the 50 EMA, sell only mode.
[02:08] Same coil. And notice, the inside bars colors don't matter. Only the range does. This time you watch the mother bars low. A candle closes below it, and your sell goes on the next candle. Same four rules, flipped. Now the part that
[02:23] protects your account, the trap. The coil can break in two directions. The coil can break in two directions. Left side, uptrend, coil breaks up with the trend, valid, take the buy. Right side, same uptrend, but the coil breaks
[02:38] down against the trend. Most beginners take that as a sell. We don't. No sell, no buy. Skip it completely. That's a shakeout trap. Same on the sell side.
[02:50] shakeout trap. Same on the sell side. Downtrend, breaks down, valid sell. Downtrend, breaks up, trap, skip it. Remember this line. One direction is a signal, the other is a warning. The 50 EMA tells you which is which. And being
[03:05] honest with you, even valid setups sometimes fail. Price breaks out, then snaps right back. That's a failed break. It happens to every breakout strategy, and no filter removes it completely.
[03:18] Your protection is simple. All four rules, or no trade. Now because things happen fast when you're trading 15-second candles, I've put together a completely free PDF guide for this exact strategy, linked in the
[03:31] description below. It covers everything we just went through, plus a one-page entry checklist you can keep open on your screen while you trade. So you never second-guess a rule. Grab that right now, and let's keep moving. Let's
[03:44] jump straight into the live market examples on my screen, so I can show you exactly how to filter out the bad setups and protect your account balance. Okay, playing out exactly the way we just learned. Price is riding above our EMA,
[03:59] the trend is clearly up, so we're in buy only mode. And right here, notice how the candles pulled in tight and coiled before this point. That's our signal building. The moment a candle broke and closed above the setup, I took the buy
[04:11] on the very next candle. There's our entry line. No hesitation, no second-guessing. The rules lined up, so we act. Now we let the market do its job. And look what happens right after entry. Price doesn't stall. It pushes
[04:23] up, candle after candle, staying well above our entry line. supposed to do. All that compressed energy firing in the trend direction. And there it is. The trade closes above
[04:36] win. Now let's wait for the next perfect setup. Because the best traders don't take every trade, they wait for the one that checks every box. Let's catch the next one together. Here's our second
[04:48] live setup, and this one is a textbook example. Look at how price climbed off the bottom and pushed above our EMA. The trend flipped clearly to the upside, so we're hunting buys only. The candles tightened into a small coil right near
[05:02] the top, and the moment a candle broke and closed above that setup, I placed the buy on the very next candle. There's our entry line. Notice I'm not chasing. I waited for the close, then acted. That patience is the entire edge.
[05:17] Now watch the trade breathe. Price pushes higher, then pulls back a little, then pushes again. It's not a straight rocket, and that's completely normal. See how it stays above our entry line,
[05:29] even through that small red candle? This is where beginners panic and close early for no reason, but we don't. We chose a clean setup with the trend behind us, so our only job now is to sit still, trust the rules, and let the
[05:42] candles finish the story. And there's the close. Finishing above our entry line, right in the green. Another clean win, and again, not by luck. Trend confirmed, coil formed, breakout closed the right way,
[05:56] entry on the correct candle. Same four rules, same result. That's what consistency looks like. Not one lucky trade, but the same process repeating. Now, let's wait for the next perfect setup, because the best traders don't
[06:10] take every trade, they wait for the one that checks every box. Let's catch the next one together. Now, here's something real. I'm taking two sell setups at the same time, side by side, so you can see exactly how this plays out in live
[06:23] conditions. Both charts showed price sitting below our EMA. Both looked like valid downtrend sells. On one of them, the coil broke clean below the setup with strong bearish candles behind it. On the other, price was hugging the EMA
[06:37] much more closely. Flatter, less convincing. watch them run together, because this is where you learn what a strong setup really looks like versus a weak one. And look at the difference already. The
[06:50] chart with the strong downtrend behind it is pushing lower, staying below our entry line, doing exactly what a release sell coil should do. But the other one, price is fighting back up toward the EMA, refusing to fall. See how it's
[07:03] weakest? This is the market telling us something. When a setup forms too close to the EMA without a clear trend behind it, it doesn't have the fuel to follow through. Same pattern, very different strength. And there are the results. One
[07:17] win, one loss. The clean downtrend sell closed right where we wanted. The weaker one, sitting too close to the EMA, went against us. I'm showing you both on purpose, because anyone who only shows winners isn't
[07:30] being honest with you. This is real trading. You follow your rules, and some setups still won't work. That's normal. But notice why. The winner had a clean, strong downtrend far from the EMA. The loser formed too close to that line. The
[07:45] further and cleaner the setup, the stronger it tends to be. Remember that when choosing which trades to take and which to skip. So, that's the double inside bar coil, the rules, the traps, and honest examples, wins and losses
[07:58] If this helped, subscribe and turn on the bell. Grab the free PDF checklist in the description and comment which part helped you most. Trade safe, practice on demo first, and I'll see you in the next one.




⚡ Saved you 0h 08m reading this? Transcribe any YouTube video for free — no signup needed.