One Sentence to Pro Infographic in 5 Min
45sShows a dramatic transformation from a simple sentence to a polished infographic, sparking curiosity about the tool.
▶ Play Clip"Delivers exactly what the title promises — a quick demo of turning a sentence into an infographic, though it's essentially a product showcase."
This video demonstrates how to quickly create a professional infographic from a single sentence using the Vengage tool. The creator shows the process of generating layout options, applying a brand kit for instant customization, and using AI-powered suggestions to improve accessibility and design consistency.
A single sentence of 33 words is converted into a professional infographic in under 5 minutes using Vengage. The tool generates four different layout options in about 30 seconds.
Each layout option has a different visual hierarchy. The chosen layout features a bold header at the top, stats in a three-column grid, and a chart positioned off to the side.
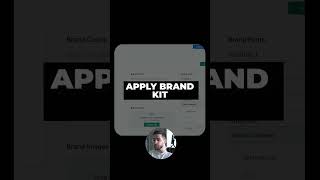
Applying the brand kit instantly updates the entire infographic: the logo drops into the corner, colors shift to the brand palette (blues, accent orange), and fonts switch to the specified ones.
The tool analyzes the infographic and provides plain-language suggestions like standardizing icon styles, adding icons to stats, updating decorative images, and flags issues such as missing alt text, poor color contrast, and screen reader incompatibility.
Vengage enables users to create polished, on-brand infographics quickly, with built-in AI assistance for design consistency and accessibility improvements.
How long does it take to turn a sentence into an infographic with Vengage?
Under 5 minutes.
How many layout options does Vengage generate?
Four different layout options.
What does applying the brand kit do?
It instantly updates the infographic with the logo, brand colors, and specified fonts.
00:26
What accessibility issues does Vengage flag?
Missing alt text, poor color contrast, and elements that won't work with screen readers.
00:40
Speed of Creation
Demonstrates the core value proposition: creating a professional infographic from a single sentence in under 5 minutes.
Instant Branding
Shows how brand kit application automates design consistency, a key time-saver for marketers.
00:26AI Accessibility Check
Highlights the tool's proactive approach to accessibility, a differentiator in design tools.
00:40[00:00] I just turned this single sentence into this professional infographic in under 5 minutes. That's it. One sentence, 33 words. I'm hitting generate. And in about 30 seconds, Vengage gives me four different layout options.
[00:13] Each one has a different visual hierarchy. This one puts the stats front and center. This one leads with a big headline and graphic. I'm picking this one. The layout with the bold header at the top, stats in a three-column grid, and the chart positioned off to the side.
[00:26] Click apply brand kit. Watch what happens. The entire infographic updates instantly. My logo drops into the corner, the colors shift to my brand palette, blues, grays, accent orange, and the fonts switch to the ones I specified. It
[00:40] analyzes the infographic and gives me suggestions in plain language, standardize icon styles, add icons to stats, update decorative images, and flags issues like missing alt text,
[00:52] poor color contrast, and elements that won't work with screen readers. Links in the description below.
⚡ Saved you 0h 00m reading this? Transcribe any YouTube video for free — no signup needed.