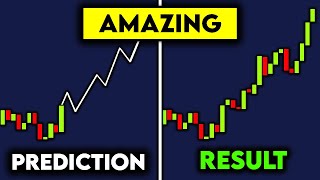

I Found an Indicator That Predicts the Future
48sThe hook is intriguing and promises a secret indicator that can predict price movement, which is highly clickable for traders.
▶ Play Clip"Title promises a predictive indicator, but the video is a basic strategy guide with a heavy broker promotion, delivering moderate value."
The video presents a trading strategy that combines three TradingView indicators—Next Pivot, SSL Hybrid, and Volume Oscillator—to predict price movements. The creator demonstrates how to configure these indicators and outlines specific entry conditions for long and short trades, claiming impressive results.
The creator found an indicator on TradingView that claims to predict the exact future of the chart, adding a projection line to the price chart.
After observing the price following the projected line exactly, the creator developed a strategy using this indicator and claims it works amazingly.
Instructions to add the 'Next Pivot' indicator from the TradingView indicators tab, which displays a white projection line for general price movement.
The 'correlated length' setting determines how many candles the indicator calculates, looking back at past patterns to project future price movement.
The creator warns that the projection indicator should not be used alone, as past patterns do not guarantee future results, necessitating additional indicators.
Instructions to add the 'SSL Hybrid' indicator, changing the SSL1 baseline length to 200 and baseline type to 'mchinley' for better market tracking.
Instructions to add the 'Volume Oscillator' indicator and customize line colors for better visibility.
The creator promotes Hankotrade, showing a $100,000 deposit with nearly $28,000 profit, recommending it for lower commissions and fast execution.
For a long trade: projection line moving upwards, bars and MA baseline both blue, volume oscillator above zero line, stop loss below recent low, take profit at recent high.
If the projection line indicates the price will hit the stop loss before the take profit, the trade should be skipped.
For a short trade: projection line moving downwards, bars and MA line red, volume oscillator above zero. Stop loss above recent high, take profit at recent low.
The video provides a step-by-step guide to a trading strategy that combines three indicators, emphasizing the importance of confirmation and filtering trades based on the projection line's direction.
What is the 'correlated length' setting in the Next Pivot indicator?
It determines how many candles the indicator calculates, looking back at past patterns to project future price movement.
01:22
What are the three indicators used in the strategy?
Next Pivot, SSL Hybrid, and Volume Oscillator.
01:04
What settings are changed for the SSL Hybrid indicator?
SSL1 baseline length set to 200 and baseline type changed to MCchinley.
02:13
What are the conditions for a long trade?
Projection line moving upwards, bars and MA line both blue, and volume oscillator above the zero line.
03:45
What is the condition for skipping a trade?
If the projection line indicates the price will hit the stop loss before the take profit.
04:29
What are the conditions for a short trade?
Projection line moving downwards, bars and MA line red, and volume oscillator above the zero line.
04:46
Price Follows Projection
Demonstrates the indicator's claimed predictive power, which is the core selling point of the video.
00:31Past Patterns Repeat
The underlying assumption of the strategy is that historical patterns tend to repeat, a key trading concept.
01:48Risk of Using Indicator Alone
The creator acknowledges the limitation of the projection indicator, emphasizing the need for confirmation.
02:01Filtering Trades with Projection
A practical method to avoid losing trades by checking the projection line's direction against the stop loss.
04:29[00:00] And its fn amazing. One day I was looking through the public library of indicators on Tradingview for fun. Yeah, I search trading indicators for I stumbled upon an indicator that claimed it could predict the exact future of the chart.
[00:19] Just as you are, I was intrigued. I added the indicator to my chart and saw that it added a projection line to what it thought the price will do next. When I first saw this, I laughed to myself thinking Wow, what an indicator. It can
[00:31] put a little line on my chart, real cool . But then a couple hours passed and I looked back at my chart and I saw the price followed the EXACT movement of the projected line. I was instantly amazed so I tested it and cooked up a beautiful strategy using this indicator.
[00:51] And lemme tell ya, it works amazing. And that s exactly why im making this I know im amazing. Let s get straight to it. First things first. You need to get tradingview. If you don t yet have it ill leave a link
[01:04] tab and type in the next pivot . Once you do this, the indicator will be added to your chart and you will see two lines. The white line, which is the projection project of the general price movement. But in order for this indicator to be
[01:22] successful you have to add a little bit more to this strategy. Which ill cover in a bit. Well if you go to the settings, there will be a setting called correlated length
[01:34] This number is how many candles the indicator will calculate. It will look at the past 20 candles and go through the entire chart history and try to find another pattern that closely resembles the one that is currently being provided.
[01:48] As what happens in the past is likely to happen in the future. Once it finds it, it will then put the projection on you chart as you see now. And as you can see, it works pretty damn well. But as I said earlier there
[02:01] you probably shouldn t use it by itself. As just because happens in the past, doesn t mean it will happen in the future. So we have to add a little bit more to this
[02:13] Go back to the indicators tab and type in ssl hybrid. Make sure you add this one, right here. Go to the settings of this indicator and change the ssl1 baseline length to 200. Then change the baseline type to mchinley
[02:30] This is just a type of moving average that was designed to track the market better than your typical normal moving average. Next, click the style tab. You re gonna wanna uncheck all these boxes besides the ma color and the bar color.
[02:43] Next, go back to the indicators tab and add an indicator called the volume oscillator. And I like to change the colors of these lines so they are a bit more visible.
[02:56] So those are all the indicators that we need. Now let s go over the juicy strategy. I m going to show you Hankotradeeee. These are my trade results using hankotrade.
[03:09] As you can see I have a #100,000 deposit and I have profited nearly $28,000. If you are looking for a broker to win more trades. I recommend clicking the link in my simply just a better broker with lower commissions and fast execution times.
[03:27] Which results in you winning more trades. They even just mitigated to their own in house trading platform called ACT Trader. Which has soooo many more benefits than mt5. match whatever you first deposit. Okay, so lets go over the strategy.
[03:45] So for a long trade, you are going to want this exact configuration. Next, you want both the bars and the ma baseline to both be blue.
[03:59] Finally, you want the volume oscillator to be above the zero line. You re going to set your stop loss right below the recent low and you re going to set your take profit at a recent high. And just like that you have a winning trade.
[04:14] Let me show you. So here all the conditions are met. The projection line is moving upwards, the bars and ma line are blue. And the volume oscillator is above the zero line. So we set out take profit and stop loss.
[04:29] But if we closely the projection line shows its going to hit our stop loss before hitting our take profit. So in this case, we do not enter the trade. Let s go over a short trade. First you want the projection be going downwards.
[04:46] You then want both the bars and the ma line to be red. And then finally, you still want the volume oscillator to be above the zero line. If all these conditions are met, you re going to set your stop loss right above the recent high and
[04:59] set your take profit at a recent low. And again, just like that you have is amazing. Try it out for yourself and let me know how it works for you on Instagram.
[05:11] This will open your eyes on how to trade correctly. Thanks for watching and ill see you guys next time.
⚡ Saved you 0h 05m reading this? Transcribe any YouTube video for free — no signup needed.



![BEST MACD Trading Strategy [86% Win Rate]](https://img.youtube.com/vi/rf_EQvubKlk/mqdefault.jpg)