
Most Popular TradingView Indicator!
45sReveals the #1 indicator with 138k boosts, instantly grabbing traders' attention.
▶ Play Clip"Delivers a solid walkthrough of the indicator, but the title oversells the 'we built' angle — it's a review, not a build."
This video reviews LuxAlgo's Smart Money Concepts (SMC) indicator, the most popular on TradingView with over 138,000 boosts. It explains how the indicator automates the mapping of market structure, order blocks, liquidity zones, fair value gaps, and premium/discount zones, and demonstrates how to combine these features for trading decisions. The video also introduces LuxAlgo Quant, an AI tool that builds Pine Script indicators.
LuxAlgo's Smart Money Concepts indicator is the most popular on TradingView with over 138,000 boosts. It turns a chart into a full SMC suite, showing market structure, order blocks, equal highs/lows, fair value gaps, and premium/discount zones.
The indicator labels 'choch' (change of character) and 'BOS' (break of structure). These help traders understand if price is continuing in the same direction or potentially reversing. For example, repeated bullish BOS labels indicate a bullish trend, so traders shouldn't look for shorts.
Solid lines represent swing structure (long-term), while dotted lines represent internal structure (short-term). This distinction helps traders align with the higher timeframe trend; e.g., in a long-term downtrend, a bullish change of character should not be followed.
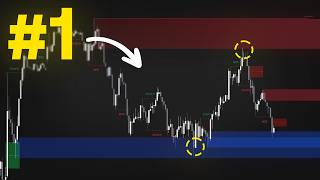
Order blocks are potential reaction zones where strong buying or selling previously occurred. The indicator marks bullish order blocks as blue boxes and bearish ones as red boxes, removing subjectivity. Example trade: wait for price to retrace into a bearish order block, place stops above, and target 1:2 or the next order block.
The indicator shows weak/strong highs and lows, and equal highs/lows. Example: after three equal low labels in a bullish trend, wait for the next BOS to enter a long trade, with stop at the swing low and target 1:2.
The indicator draws FVGs in real-time and has an auto-threshold setting to filter out non-significant gaps. Users can also choose a higher timeframe (e.g., 15-minute) for FVGs to reduce clutter.
One FVG, order block, or BOS alone doesn't mean much, but when they align, the story becomes clearer. The indicator helps traders see the confluence of these factors.
The indicator shows where price is trading within a range. If price is near the premium zone, traders should avoid buying; they should only buy at equilibrium or below (discount).
Every setting can be toggled on/off, and colors can be changed to suit individual trading styles, making the chart less overwhelming.
Quant is an AI that builds indicators using Pine Script, claimed to be better than ChatGPT, Claude, or Gemini for this purpose. Users can describe an indicator in plain language and Quant builds it in seconds.
To use a Quant-built indicator, copy the code, open the Pine Script editor in TradingView, create a new indicator, paste, and save. The indicator appears on the chart instantly.
The indicator is a full SMC toolkit, but it should be used as a framework, not a magic button. Traders should look for the story behind price: liquidity, structure shifts, imbalances, order blocks, and premium/discount.
LuxAlgo's Smart Money Concepts indicator provides a comprehensive, automated SMC toolkit that simplifies chart analysis and helps traders identify high-probability setups. The key is to use it as a framework to understand the story behind price, not as a standalone signal generator.
What do the labels 'choch' and 'BOS' stand for in Smart Money Concepts?
CHoCH = Change of Character, BOS = Break of Structure.
01:13
In the indicator, what do solid vs. dotted lines represent for market structure?
Solid lines represent swing structure (long-term), dotted lines represent internal structure (short-term).
02:04
What colors are used for bullish and bearish order blocks in the indicator?
Bullish order blocks are blue boxes, bearish order blocks are red boxes.
02:45
What is the auto-threshold setting for fair value gaps?
It filters out non-significant fair value gaps, showing only the ones that matter.
04:04
How can you change the timeframe for fair value gaps in the indicator?
Go into the settings and choose the desired timeframe (e.g., 15-minute) for the FVGs.
04:18
What is LuxAlgo Quant?
An AI that builds indicators using Pine Script, claimed to be better than ChatGPT, Claude, or Gemini for this purpose.
05:41
According to the video, what is the key to using the SMC indicator effectively?
Use it as a framework, not a magic button, and look for the story behind price (liquidity, structure shifts, imbalances, order blocks, premium/discount).
07:05
Most Popular Indicator
Establishes credibility and relevance by citing the 138,000+ boosts, making the review immediately valuable.
00:01Swing vs Internal Structure
Clarifies a common point of confusion in SMC, helping traders align with the higher timeframe trend.
02:04Confluence is Key
Emphasizes that individual signals are weak, but combined they create a strong trading story — a core SMC principle.
04:47AI-Powered Indicator Building
Introduces a practical tool (Quant) that can save hours of manual Pine Script coding.
05:41Framework, Not Magic
Delivers a crucial warning against over-reliance on indicators, reinforcing the need for context.
07:05[00:01] is the most popular indicator on TradingView with over 138,000 boosts. This is LuxAlgo's Smart Money Concepts indicator and it's crazy.
[00:14] Instead of just giving you one simple signal or one basic overlay, this thing basically turns your entire chart into a full Smart Money Concepts suite. It shows market structure, order blocks, equal highs and equal lows, fair value
[00:29] gaps, premium and discount zones, and a lot more directly on your chart. And that's why so many traders use it. SMC can get really complicated super fast where structure is shifting, where liquidity is sitting, where price might
[00:45] react, which order blocks really matter, and whether a move is just a sweep or a real breakout. And if you're trying to do this all manually on your chart, your chart can get messy fast. This indicator automatically maps out everything for
[01:00] you in real time. So, you're not just sitting there manually drawing every single zone, level, and structure shift yourself. The first big thing you're going to notice is market structure. You'll see two labels on the chart,
[01:13] choch, which stands for change of character, and BOS for break of structure. These labels are really important because it helps you understand if price is continuing in the same direction or potentially starting
[01:25] to reverse. For example, if you keep seeing break of structure labels means you have a bullish trend and you shouldn't be looking for shorts. character label, you should be looking for the reverse. So, you can see we had
[01:39] some consolidation around this area and then price just plummeted down. And on the flip side, if price keeps breaking lows and you keep getting bearish break of structure labels, you should be looking for shorts. So, for instance,
[01:51] once you get this first break of structure label, you can add a fib level, enter the trade at 0.5, and target the low. And that would be a 2.44 RR. Now, you will see for the market structure that there's dotted lines and
[02:04] solid lines. The solid lines represent swing structure, while the dotted lines represent internal structure. That just basically means long-term and short-term structure. So, we can see this long-term bearish break of structure, so we
[02:17] shouldn't be following a bullish change of character because we know long-term we are in a downtrend. Now, another huge part of this indicator is order block. A lot of smart money traders will use order blocks as potential reaction zones
[02:32] because they can show areas where strong buying or selling previously occurred. But, order blocks can be extremely subjective and it can get pretty confusing. So, this indicator will spot them for you and mark them on the chart.
[02:45] Bullish order blocks are going to be blue boxes, while bearish order blocks are going to be red boxes. So, like I said it before, we are in a bearish break of structure label. Price then formed a bearish order block along with
[02:58] a bearish change of character. What we can do is we can wait for price to retrace into the bearish order block, take the trade from there, stops above the order block, and then we can just target a one to two or the next order
[03:12] can be with this indicator. This indicator can also help you track where liquidity is resting. It'll show weak highs and lows, strong highs and lows, equal highs, and equal lows. For example, we just got three equal low
[03:28] labels in a row and we know we're in a bullish trend based on this break of structure label. We also just formed a bullish order block. So, what we can do is we can wait for the next break of structure label to appear. When that
[03:40] happens, we can enter a long trade. We can put our stop at the swing low and target a one to two. And again, it's that simple with this indicator. Now, another feature that's super important is fair value gaps. Now, we have all
[03:52] heard fair value gaps and trying to manually draw every single one on your chart gets to be tedious. Now, what's nice about this indicator is not only does it draw these fair value gaps in real-time, but instead of your chart
[04:04] looking all messy with all these fair value gaps, there's actually an auto threshold setting. And if you toggle that, it filters out the non-significant looking at the fair value gaps that actually matter. [music]
[04:18] time frames, like for example, right now I'm on the 5-minute chart, you can go into the settings and choose what time frame you want the FVGs to be based off of. So, I can go down and click the 15-minute FVGs, and now it'll only show
[04:32] chart. Once you combine all these features of the indicator, price gives you a much cleaner story because by itself, one fair value gap doesn't mean much, one order block doesn't mean much, and one break of structure doesn't mean
[04:47] much. But when all these things line up, that's where the real magic happens, meaningful. Now, another feature that I really find helpful is the premium and discount zones. It pretty much shows where price is trading within a range.
[05:01] sitting pretty close to the premium zone. So, we wouldn't want to buy at this area. I would only want to buy if we reach the equilibrium or below. And what's truly the most remarkable thing about this indicator is that every
[05:15] setting can be turned on or off depending on how you trade. So, maybe I don't trade order blocks all the time. I can simply turn those off and they'll disappear from my chart. You can change the colors of everything to better suit
[05:28] just makes everything feel less overwhelming. So, that's the rundown of the Smart Money Concepts indicator by LuxAlgo. And before we finish, I just want to mention something that's pretty exciting. This whole indicator can be
[05:41] built using LuxAlgo Quant. Quant is basically an AI that builds indicators using Pine Script, And it's a lot better than these other AIs because it was indicators. So, instead of using stuff like ChatGPT, Claude, or Gemini, which
[05:58] can lead to several errors and taking way longer than it needs to, you can head over to luxalgo.com/quant and build the indicators here. So, for example, you can type something like create an indicator that detects break
[06:11] of structure and change of character, highlights bullish and bearish order blocks, marks equal highs and lows as liquidity zones, detects fair value gaps, and shows premium and discount areas based on the current range. And
[06:24] Quant can build it in just seconds. And it really is a huge deal because these kinds of indicators can take forever to build manually. And to put this on your chart, all you would have to do is go to the code view, click copy, that copies
[06:38] TradingView, you'll see this little triangle down here, that's the Pine Script editor. You'll click into that, create a new indicator, name it SMC, chart. And now we have the entire indicator right on our chart in just a
[06:53] couple of seconds. So, if you want to check that out, I'll leave a link for Quant right in the description, as well as the Smart Money Concepts indicator. But overall, there is a reason why this is the most popular indicator on
[07:05] TradingView. It gives traders a full Smart Money Concepts toolkit in one place. But the key is to not treat it like a magic button. Use it as framework and look for the story behind price. Where is liquidity sitting? Has
[07:18] structure shifted? Did price create an imbalance? Is price returning to an order block? Are we in premium or discount? When you start combining all becomes a lot easier to read. Now, hopefully you found this useful, and if
[07:32] you did, make sure to like the video, subscribe, and let us know which indicators you want us to cover next. Thanks for watching, and I'll see you in Thanks for watching, and I'll see you in the next one.
⚡ Saved you 0h 07m reading this? Transcribe any YouTube video for free — no signup needed.