
Refining FVGs for Precision
60sTeaches a unique technique to improve trade accuracy, appealing to traders seeking an edge.
▶ Play Clip"Delivers a solid, actionable strategy with real examples, though it's a bit padded with repetition and promotion."
This video explains how to identify high-quality fair value gaps (FVGs) and presents a complete trading strategy based on smart money concepts. It covers the definition of FVGs, how to refine them, and a step-by-step plan for trading them across multiple time frames, with real chart examples.
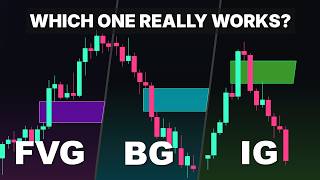
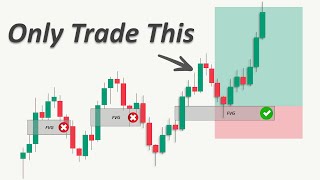
The video explains what makes a fair value gap high quality and worth trading, and introduces a strategy using smart money concepts called 'fair value gap in fair value gap'.
A bullish FVG is the space between the upper wick of the first candle and the lower wick of the third candle in a three-candle sequence. A bearish FVG is the space between the lower wick of the first candle and the upper wick of the third candle. Color, shape, and size do not matter.
A bullish FVG shows a buy-side imbalance, indicating buyers were stronger than sellers, often due to large institutional orders. This creates an inefficient move, and price usually returns to the FVG area to fill or mitigate it. The same applies to bearish FVGs.
Marking FVGs helps identify where institutional players have entered the market and pushed price strongly. When price returns to these gaps, reactions often provide good trading opportunities.
On the pound-dollar 1-hour chart, price tapped into a bearish FVG and moved down, then formed another FVG and rejected again. On the euro-dollar 1-hour chart, price reacted multiple times to the FVG before a reversal. FVGs appear on all time frames, including daily.
For day traders, large daily FVGs are too big to trade. Refining means zooming into a lower time frame to find a more accurate FVG inside the larger area. For example, a 4-hour FVG inside a daily zone provides a tighter, more precise zone. This method also applies to order blocks and supply/demand zones.
When multiple FVGs exist, only buy in the discount zone (below the 50% retracement level) and only sell in the premium zone (above 50%). This increases success chances and reduces the risk of becoming a liquidity target. Stop loss should be placed below the swing low, and the first target is the recent high.
If price breaks below the swing low, market structure shifts bearish, and a long trade would go against the trend, unless the break is identified as a liquidity grab.
The strategy uses two time frames: a higher time frame for general analysis (market structure, direction, key levels, liquidity, and FVGs) and a lower time frame for confirmations and entries. The entry time frame must be two time frames lower than the higher time frame.
Apply smart money market structure concepts: look for breakouts, reversals, and liquidity sweep patterns. A liquidity sweep above a previous high signals a potential reversal, confirmed by a break and close below a swing low (change of character).
Use an indicator to mark the latest FVGs. Increasing sensitivity filters out smaller gaps and shows only larger ones. After identifying the optimal zone, wait for price to tap into it, then move to a lower time frame for confirmations.
Wait for price to enter the trading zone and look for confirmation of reversal (e.g., liquidity sweep or change of character). Enter at the start of the FVG zone, place stop above (for shorts) or below (for longs), and target key levels. For conservative approach, wait for break below recent low.
The higher time frame gap defines the optimal reaction zone, while the lower time frame gap provides precise entry timing after confirmation. The lower time frame FVG does not need to be exactly within the higher time frame gap.
For a very small FVG, use a larger zone for stop loss to protect from normal fluctuations. For a large FVG, either use a smaller zone below the FVG as stop or place the buy order in the middle of the zone to improve risk-to-reward.
On the 1-hour chart, a downtrend was followed by a liquidity sweep and change of character, turning bias bullish. Two FVGs were identified, but only the one in the discount zone was valid. After price returned, zoomed into 5-minute chart, saw change of character, identified a new FVG, placed buy order at its start, stop below, target next zone.
On a downtrend with multiple FVGs, only one zone was valid supply after applying retracement. Price retraced, and on the 5-minute chart, a change of character and FVG formed. Sell order placed at FVG start, stop above. Losses are part of trading; follow rules and risk management.
The video provides a structured, multi-time-frame strategy for trading fair value gaps, emphasizing the importance of selecting high-quality zones (discount/premium) and using confirmations on lower time frames. It stresses that losses are inevitable, but consistent rule-following and risk management lead to long-term success.
What is a bullish fair value gap?
The space between the upper wick of the first candle and the lower wick of the third candle in a three-candle sequence.
00:34
What does a bullish FVG indicate in terms of price action?
A buy-side imbalance, meaning buyers were stronger than sellers, often due to big institutional orders, creating an inefficient move that price will likely return to fill.
01:00
What is the rule for buying or selling in relation to the 50% retracement level?
Only buy in the discount zone (below 50%) and only sell in the premium zone (above 50%).
03:25
Why is it safer to buy in the discount zone?
Because the market often takes out liquidity at highs, so buying in the discount zone reduces the risk of becoming a liquidity target and increases the chance of success.
03:40
What is the recommended stop loss placement for a long trade?
Below the swing low, to keep the stop close to that level.
03:55
What is the 'FVG in FVG' strategy?
Using a higher time frame to identify the optimal reaction zone (FVG) and a lower time frame (two time frames lower) to find a precise entry FVG after confirmation.
05:00
What is a change of character (CHoCH)?
When price fails to create a new high and then breaks the swing low, indicating buyers have failed and sellers are in control.
06:33
What should you do if the market direction is unclear on your selected time frame?
Move on to another asset with a clearer trend to stay disciplined.
07:27
How do you handle a very small fair value gap?
Use a larger zone for your stop loss to protect it from normal market fluctuations.
10:09
How do you handle a large fair value gap on the lower time frame?
Either use a smaller zone below the FVG as your stop or place your buy order in the middle of the zone to improve risk-to-reward.
10:21
FVGs indicate institutional imbalance
Explains the core concept that FVGs represent inefficiencies created by large orders, which is fundamental to smart money trading.
01:00Discount vs. premium zone rule
Provides a clear, actionable rule for selecting which FVG to trade, improving risk-reward and reducing liquidity risk.
03:25FVG in FVG multi-timeframe strategy
Introduces a structured, repeatable trading plan that combines higher time frame analysis with lower time frame precision.
05:00Change of character definition
Defines a key smart money concept used to confirm reversals, essential for entry timing.
06:33Losses are part of trading
Emphasizes the importance of risk management and consistency, a crucial principle for long-term success.
12:25[00:02] trading opportunities on the chart. However, not every gap is a good one to In this video, we're going to explain what makes a fair value gap high quality and worth trading. We'll also share a strategy we've developed using smart
[00:16] money concepts called fair value gap in fair value gap. Additionally, we'll provide multiple real chart examples. If that sounds interesting to you, make us in making more videos and subscribe to our channel if you're new.
[00:34] that a bullish fair value gap is a space between the upper wick of the first candle and the lower wick of the third candle in a three candle sequence. candle in a three candle sequence. Similarly, a bearish FVG is a space
[00:47] candle and the upper wick of the third candle. The color does not matter and they can be in any shape or size. But what do fair value gaps show in terms of price action?
[01:00] A bullish FVG shows a buy-side imbalance, meaning buyers were stronger than sellers, often because of big institutional orders. This creates an inefficient move in the market and the price will usually return
[01:12] to the fair value gap area to fill or mitigate it. The same concept applies to the bearish scenario. fair value gaps is one of the first things we do when we open the price
[01:25] But why do we even need to mark them on the chart? have entered the market and pushed the price strongly. When price returns to these gaps, we often see reactions that can give us a good trading opportunity.
[01:40] Here on the pound-dollar 1-hour chart, price tapped into the bearish fair value gap and moved to the downside. Then it formed another FVG and rejected to the downside again. On the euro-dollar 1-hour chart, you can
[01:53] see how many times the price reacted to the fair value gap before the reversal happened. We can apply this concept to all time frames. Even on the daily chart, you'll see that the price also forms FVG areas.
[02:06] This particular gap was created by strong buying pressure and continuous upside momentum during the day. We expect the price to eventually return to this FVG and give us a long opportunity.
[02:19] However, for a day trader, this zone is too large to trade, so we refine it. Refining a fair value gap means zooming into a lower time frame to find a more accurate FVG inside the larger area.
[02:33] For example, if we zoom into the 4-hour chart, we can mark a 4-hour FVG inside that large daily zone. This way, instead of a large daily imbalance, we get a tighter and more precise zone to work with.
[02:46] Now, this refining method is not limited to fair value gaps. You can use it to refine order blocks, supply and demand zones, and more. Now, we reach the next important topic. Which fair value gap should we choose to
[02:58] In this trading example, we have chart. The trading idea is to wait for the price to enter these zones and look for buying opportunities. However, we are
[03:11] only interested in buying when the price taps into the middle one. So, why are we If we take the start and the end of the latest impulsive move and apply the retracement tool, you'll notice that the second FVG is located below the 50%
[03:25] level, which is the discount zone. While this FVG is located above the 50% level, which is the premium side of the range. We are only interested in buying in the discount zone for multiple reasons. Usually, the market loves to take out
[03:40] So, a safer way to enter a long trade is to wait for the price to enter the discount area. This increases the chance of success and reduces the risk of becoming a liquidity target. Also, wherever we buy,
[03:55] the safest level to place the stop loss is below the swing low. Therefore, we want to keep our stop close to that level. Additionally, our first target would be the recent high. So, if we enter at the
[04:07] first FVG, there is simply not enough room for a proper reward. This method works best when the market makes deep retracements. The reason we are also not interested in buying at the lower FVG is that if price
[04:20] breaks below the swing low, the market structure shifts bearish. And a long trade would go against the trend, unless we identify this break as a liquidity grab, in which case price might still move higher.
[04:33] scenario. Here, we have two fair value gaps. But if we apply the retracement tool from the start of the move to the end, we can see that only the higher one is located inside the premium zone.
[04:47] So, we are only interested in selling in the premium area. This ensures a safer stop loss placement and allows for a higher reward. There are additional concepts that can be applied to the chart to improve fair
[05:00] value gap accuracy, such as market direction, breakouts and reversals, liquidity, and more. The fair value gap in a fair value gap This trading plan consists of two major time frames.
[05:14] First, we have the higher time frame, where most of the general analysis takes We will study the market structure to determine direction, key levels, liquidity areas, and most importantly, fair value gaps, which serve as optimal
[05:28] trading zones and can potentially provide high-quality setups. the lower time frame to look for confirmations and execute entries. limited to any specific chart or time frame. However, your entry time frame
[05:43] must be two time frames lower than your higher time frame. Here are three time frame combinations you can use based on your trading style. For example, if your higher time frame is the 4-hour chart, you should zoom
[05:55] trade. As I mentioned, we have simplified this trading plan into two major parts. So, let's begin with the first one. Analyzing market structure on the higher time frame.
[06:08] In this general analysis, we apply smart money market structure concepts to levels. To identify the direction, we look for breakouts, reversals, and liquidity sweep patterns.
[06:21] breaks of structure to the upside, indicating that the overall direction is Then, the market forms a liquidity sweep above the previous high, signaling a
[06:33] potential reversal. This reversal is later confirmed once we get a break and close below this low, which is called a change of character It happens when price fails to create a new high and then breaks the swing low
[06:46] This tells us that buyers have failed to defend their positions and sellers are now in control. price moves below the area and triggers the stop losses and then quickly comes
[07:00] When this happens, we expect a push to the upside. Similarly, a bearish liquidity sweep happens when price engages liquidity above a swing point and then quickly returns below the range.
[07:13] the downside. Bullish and bearish liquidity sweeps are marked respectively with green and red circles on the chart. Now, remember, if structure and direction on your selected time frame, it is better to move on to
[07:27] another asset. When market direction is unclear, the probability of making poor trading decisions increases. Switching to a pair with a clearer trend helps you stay disciplined.
[07:40] structure on the higher time frame is to identify high quality fair value gaps to trade. So, let's mark the fair value gaps using The indicator does a good job of marking the latest FVG's without making the
[07:55] In the settings tab, increasing the sensitivity filters out smaller gaps and only shows the larger ones. After identifying the optimal trading zone, we wait for the price to tap into that area and then move to a lower time
[08:10] frame to look for reversal confirmations and execute the trade. This is the general approach of the trading plan. Here is the checklist of concepts that Here is the checklist of concepts that we apply to the higher time frame.
[08:25] execute the trade on the lower time After waiting for price to enter our trading zone, we must see some form of confirmation that the short-term uptrend has ended and that price is ready to
[08:38] move downward. To identify this reversal, we focus on market character. A valid liquidity sweep above the previous high indicates that a potential reversal may be forming.
[08:51] You can enter a short position at this point. Place your stop loss above the high of the liquidity sweep candle and target the key levels ahead of price. However, for a more conservative approach, you can wait for price to
[09:05] break below the recent low to confirm the change in character. Once the reversal is confirmed, we wait for price to form new fair value gaps. This is why the strategy is known as FVG and FVG.
[09:19] However, this does not mean that the lower time frame fair value gap must be located exactly within the higher time frame gap. The key point is that the higher time frame gap defines the optimal reaction zone, while the lower
[09:32] time frame gap provides precise entry timing after confirmation. After spotting an FVG in the lower time frame, we set our sell limit at the start of the FVG zone and put our stop above. For
[09:44] the first target, we make our trade break even by closing half our position target. The next target will be the first important zone in front of the price in the higher time frame.
[09:56] Now, before looking at real chart examples, that happen on the chart and how to handle them. In the first scenario, we have a very small fair value gap. When this happens,
[10:09] you should consider using a larger zone for your stop loss, so it is protected from normal market fluctuations. In the opposite scenario, we have a large fair value gap on the lower time frame, and the issue here is that placing the stop
[10:21] below this zone would result in a very large stop loss. In this case, we can either use a smaller zone below the FVG as our stop or place our buy order in the middle of the zone. By doing this, our risk-to-reward ratio improves
[10:35] significantly if the trade ends up being a winner. examples. On the euro-dollar 1-hour chart, we were in a clear downtrend until we saw a
[10:48] character. Both of these signals indicate that sellers are no longer in control and that our directional bias has turned bullish. On this chart, we can identify two fair
[11:00] value gap areas, but only the one located on the discount trading zone for us. After identifying this area, we simply wait for price to return into the FVG and then zoom into a lower time frame to
[11:14] look for long trade opportunities. When we move to the 5-minute chart, of character by breaking above this level, which acts as our confirmation and reversal signal. At this point, we identify a new fair
[11:28] value gap on the 5-minute time frame and place our buy order at the beginning of Let's set our stop loss below it and target the next important zone in front of the price. Let's see how this trade plays out.
[11:45] see a clear downtrend with multiple fair value gaps. But after applying the retracement tool, only one of these zones is a valid supply according to our rules. Once we mark our trading zone, we wait
[11:57] for price to retrace back into the area and then zoom into a lower time frame to execute the trade according to our plan. On the 5-minute chart, price forms a change of character along with a fair value gap, giving us our entry setup. We
[12:11] place a sell order at the beginning of the FVG zone and set our stop loss above the FVG zone and set our stop loss above it. However, loss is part of trading.
[12:25] No matter how good your strategy is, losing trades are unavoidable. And a was wrong. The most important thing is to clearly define your rules, stick to them, and follow proper risk management.
[12:39] As long as you do that consistently, you will be fine in the long run. So, that's it for this video. I hope it provided value to you. If it did, please go ahead and hit the like button to show your support. And if
[12:53] subscribing. I'll see you in the next episode.
⚡ Saved you 0h 13m reading this? Transcribe any YouTube video for free — no signup needed.