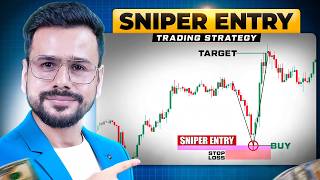

Sniper Entry: 1:10 Risk Reward
40sPromises extremely high reward with minimal risk, appealing to traders seeking quick profits.
▶ Play Clip"Title accurately describes the strategy; video delivers on combining Order Block and FVG for sniper entries."
This video teaches a sniper entry trading strategy that combines Smart Money Concepts (SMC) tools like Order Blocks and Fair Value Gaps (FVG) across two timeframes. The goal is to achieve high risk-to-reward ratios, up to 1:10, by taking precise entries with minimal risk.
Sniper entry means taking a very precise entry where the market moves up immediately, minimizing risk and maximizing reward, up to 1:10 risk-to-reward.
Use a higher timeframe (e.g., 4-hour) for analysis and a lower timeframe (e.g., 15-minute) for entry. For swing trading, higher could be weekly, lower 4-hour; for intraday, higher 4-hour, lower 15-minute.
Switch to line chart on the 4-hour timeframe to identify key support and resistance levels, then mark them using horizontal rays.
After marking support/resistance, identify the Order Block (the candle before the one that starts the move) and any Fair Value Gap (FVG) using rectangles.
Go to the 15-minute timeframe. If the Order Block from the higher timeframe is mitigated (price moved through it), it's no longer valid. Focus on support/resistance and new Order Blocks/FVGs on the lower timeframe.
Enter when price touches the FVG, either at the 50% level or as soon as it touches. Place stop loss slightly below the FVG. Target can be the swing high or previous resistance.
Example shows a trade with 1:8 risk-to-reward. Even if you miss the full move, you can re-enter on new FVGs for additional profits.
HPZ occurs when the trend in both higher and lower timeframes is the same (both bullish or both bearish). If trends conflict, it's a low probability zone and should be avoided.
By combining higher timeframe analysis (support/resistance, Order Blocks, FVGs) with precise entries on a lower timeframe, traders can achieve high risk-to-reward ratios. The High Probability Zone concept further increases accuracy by ensuring trend alignment across timeframes.
What is a sniper entry in trading?
A very precise entry where the market moves up immediately, minimizing risk and maximizing reward, often up to 1:10 risk-to-reward.
00:03
What two timeframes are recommended for intraday sniper entries?
Higher timeframe: 4-hour; lower timeframe: 15-minute.
00:28
How do you mark support and resistance on the higher timeframe?
Switch to line chart, identify key levels, and use horizontal rays to mark them.
00:54
What is an Order Block?
The candle immediately before the one from which the price starts moving in the desired direction.
02:32
What does FVG stand for and how is it drawn?
Fair Value Gap. It is drawn using a rectangle from the high of the previous candle to the low of the next candle, covering the gap.
07:09
What should you do if the Order Block from the higher timeframe is mitigated?
It is no longer valid; rely on support/resistance and new Order Blocks/FVGs on the lower timeframe.
05:59
Where do you place stop loss when entering on an FVG?
Slightly below the FVG, or below its 50% level if the candle is large.
08:29
What is the High Probability Zone (HPZ)?
When the trend in both higher and lower timeframes is the same (both bullish or both bearish).
15:36
What is the risk-to-reward ratio example given in the video?
1:8, meaning risking ₹1 to earn ₹8.
09:41
Sniper Entry Definition
Defines the core concept of the strategy: precise entry with minimal risk and high reward.
00:03Order Block Identification
Key SMC tool explained with practical example.
02:32Entry on FVG
Shows exact entry method on the lower timeframe.
07:36Risk-to-Reward Example
Demonstrates potential profitability with 1:8 ratio.
09:27High Probability Zone
Introduces trend alignment concept to increase accuracy.
15:08[00:03] teach you how you can take sniper entry in trading. Sniper entry means taking a very precise entry. Meaning, the market will go up from wherever you enter and its biggest advantage is that your risk will be
[00:15] very minimal and the reward will be huge. Meaning here we are going to talk about risk reward up to 1:10. So look, to get sniper entry you have to see two things first. One is higher time frame and the other is lower time frame.
[00:28] So here I will use 4 hour time frame and 15 minute time frame. Now minutes then you want, you can trade in a similar manner as per swing trading
[00:41] and take sniper entry. So first of all we start with the four hour four hour time frame in the chart. So what's the first thing you need to do in your four-hour time frame? As soon as you come to the chart, you have to
[00:54] Now I have to show you some examples, so those examples will be from here, so let us take them from here. So here you see what this is? This point is your resistance. And if I talk about support, then your support will be somewhere here.
[01:08] If we see this candle, it will be your support. Now I know there is some confusion around candlestick patterns. So what do we do from here? From here we first mark the line chart. So we have changed the candlestick chart
[01:20] to a line chart. Now after this we have to mark our support and will we do? What we see here is that this is our support and this is our you can go here and select horizontal ray. You
[01:36] So I have taken the horizontal ray here and I mark the horizontal ray from this place. So you can see what this level is ? This is my support level. And as far as the resistance level is concerned, here we can
[01:50] see that this is my resistance. If I take the example beyond this, then we will assume not yet ready for us. So here we have resistance somewhere. So I go back here. I we have resistance somewhere. So I go back here. I
[02:05] we have also marked our resistance at this place. So first of all we have marked the support and resistance. because we were using line charts. Now convert it back into a candlestick chart. So what are we doing ? Where are you doing this? We are
[02:18] In this case, we are using a time frame of 4 hours. So you have marked support and resistance. So now we have to use our smart money concept. Two things are very important in the smart money concept. One is FVG and the other
[02:32] is order block. So now let us assume that this chart of yours is ready till here. So here you can see that this was a level after reaching which the price started increasing. Even the price was falling. The price has increased after going here.
[02:46] So what is the candle that comes before the candle from which the price starts rising our order block. I have also taught you this in the video on Smart Money Concept. him that too. That means
[03:04] So what will we do now? We can see it here. If we have to find the order block, then you can see that from this candle, this green colored candle, the market started forming from here. So what is the candle before this one?
[03:17] So we will mark the order block here. First we have marked the support and mark the order block. So to mark the order block, you go here and here you get the option of a rectangle. You select it.
[03:31] After selecting the rectangle, we have to come here and from here we we have to come here and from here we mark our rectangle which will be mark our rectangle which will be something like this. You can see that
[03:44] I've marked my rectangle. I will adjust this a little bit. We will mark our last candle. So here we have its wick and here we have its upper wick. So what have I marked in this way? Here
[03:59] If I see the option to write, I also write here. Here I will write OB, that is, what is this? This is my order block. So here we have written that this is our order block. We have marked our support and resistance.
[04:13] Where have you marked it? Marked in higher time frame. Now look here I could see the marked the order block. If I see any fair value gap somewhere here, I can also mark the fair value gap. So whatever you are seeing,
[04:26] whether you are seeing order block or fair value gap, you have to So let me summarize it once. What did we do first? We have frame in this case because we are talking about intraday trading
[04:39] we have marked the support and resistance. After that see any fair value gap here? we seeing any liquidity gap? Whatever you see, mark it.
[04:53] So we have marked the order block. Now after this you have to go to the 15 minute time frame which will be our lower time frame. We are using the 4-hour time frame for analysis purposes only. frame. We are using the 4-hour time frame for analysis purposes only.
[05:06] But we want our entry to be absolutely precise. So we have first absolutely precise. So we have first here I have clicked on 15 minutes. As soon as I clicked on the 15 minute time frame, I could
[05:19] As soon as I clicked on the 15 minute time frame, I could before moving ahead, if you do crypto trading then I have You can open your account from there in which you get leverage up to 200 times.
[05:32] You can trade 24*7. And if you open your account using our link, then first of all you will get a discount on your trading fees. And secondly, below I have filling out that form, you may also be eligible for our upcoming giveaways.
[05:46] we had marked the order block in the four-hour time frame. But here we see that the order block got mitigated a little further ahead. That means we had created an order block but after that the price started coming down. So if the price goes down then it
[05:59] means that the order block has been eliminated. That means the orders that were there have been filled. no longer of any use to us. So let me delete this from here. So first of all From which we get a basic idea. So now we are left with support and
[06:14] resistance. So what will we do now ? Let us assume here that you have to take a trade somewhere, then what you will do is that you will if we look carefully here, you will see that this is a level where after reaching there, the
[06:29] price again went into a good movement. The price went up from here but then came down again. But if we look from here, the price has gone up after this. So, suppose you were thinking of taking a trade somewhere here, then you will see
[06:41] that this is a level where after reaching it the price has gone up, so the candle before this will also work as an order block for us. So here also I mark one of my order blocks. So, this is our order block and apart from this,
[06:54] you will see that our FVPG is also formed almost in this candle. So from here we have again taken the rectangle option and after that if you see then this is our big green colored candle. So,
[07:09] starting from the high of the previous candle and starting from the low of the next candle, we draw our FVG here in this manner. So here, firstly, I have marked my order here you can see that I have marked my fair value gap. So now we have to
[07:23] here. So you marked the order block. Fair value gap marked. Now after this, as soon as the price comes near this level, you can take your buy entry there and here the first thing is that you have done the analysis in the 4 hour time frame
[07:36] doing the analysis in the 15 minute time frame, then the chances of your analysis turning out to be correct will be very high and now you will see that as soon as the price has touched your FVG, the price has gone up from there. Look, I have
[07:50] taught you two-three types of entries in FVG. Firstly, you can take entry even after reaching the 50% level. Secondly, as soon as the price touches FBG, you can take entry there also. So if you want to take sniper entry and if you work in this manner
[08:02] then you can take your entry there in this manner also. So now you see here that as soon as the price has come near FVG and after that the price has increased. Now here So I will show you an example further. But first let me calculate and
[08:16] show you that if you had taken entry here, which increased after the price came near FG, then how much profit you could have made at this place or what would have been your risk to reward ratio. So what will we do for this? We have
[08:29] selected our entry mark option here. You would have taken entry at this place. Your stop loss would have been around here, slightly below the FVG. Now see, for the target, I have told you that first of all you can either take it till the swing high,
[08:43] which if you do not look at the chart properly then you will be seeing your swing high here. But because you must have also seen the chart of four hour time frame. So at this place you will know that the swing high is almost here also.
[08:57] That means you can take your target to this place also. So if I mark a swing high here for you accordingly. So here we are marking a swing high. Now look, we have marked the swing high. So you know
[09:12] that you can carry your target here also. So now see, I will show you how much your target will be achieved. So I told you about 1:10 and here you are taking a proper target and in that you are getting a risk to reward ratio of 1:1.
[09:27] Now I can admit that not everyone will be able to grasp such a high risk to reward ratio. So for this let's assume what you did at this place? You thought that no brother, my swing high is right here and you have also taken a
[09:41] risk to reward ratio of 1:8 here. Now look at this swing high, you can see it. So you will definitely keep your target this much and you will definitely keep your target this much and your stop loss will be small. That means 1:8 means if you are
[09:53] taking a risk of ₹1 then you can earn ₹8. If you are taking a risk of Rs 1000, you can earn Rs 8000. So first of all I gave you an example to explain the basics. Now, I know this might seem like a fluke to you. So let me take you
[10:05] ahead and let us assume that this is where you exited your trade. So in a way you must have said goodbye here. Here your trade would have been exited and you would have earned 1:8. But now you look again because you have done your proper
[10:18] analysis. So do you see an FPG forming again? If you look carefully, you will again see a fair value gap forming here. Suppose the chart of the next candle is not yet formed. You came here. You
[10:30] took your target and after that you saw that the movement that came here was very sudden. So what will you do? You will again mark a fair value gap here. For this you took the rectangle tool from here. Then here is your
[10:44] swing high of the previous candle and here is your swing low of the next candle. You click here and in this way you have again marked an FVG here. So now see you marked FVG again and after that what you did was last time
[10:59] you did bye here. Stop loss was placed here. You had set your target here. After that, it doesn't matter to you whether the price goes there or not. But again you saw that the price has come close to this level again. Well, I told you that if
[11:12] you wanted, you could have taken it from here to here in a single trade. If you had seen the previous swing. Had not seen it. So what did you do? You marked your Effigy here again and then what would you do as soon as the price came near this level again
[11:24] ? You could have entered here again. You would have to place your stop loss here. But since this candle has risen, you can also keep your stop loss below its 50% level. And for the target,
[11:37] you could either take the previous swing high. Otherwise what have I done to you? I first showed you the support and resistance marks on the 4-hour time frame. So here also you could have taken your target with you. Let's assume
[11:50] you hit buy here. If you had been aiming for this, you would have made profit at this place once again. This profit is not that big. In this, your risk to reward ratio is also not that big. But you were
[12:02] already capturing 1:8 anyway. So here I told you that if you take the one below FVG then at this place you are not getting even 1:2 around 1:2. It is available in the ratio of 1:7. But I told you that the candle is very big so you will have to
[12:17] take it a little below its 50% level. So you will get a risk reward ratio of 1:3 here. So I had earned 1:8 earlier. Now after this you have earned 1:3 here. But if you had seen the previous swing high, you could have
[12:31] exited your trade here also. Let us assume that you exited your trade here. So again now let's see if we have any FVPGs here or if we're getting any trades again. So look,
[12:43] you would have taken your target here. After that, if you see that the market is moving sideways, then you do not take any major risks. Meaning no trade should have been taken. But here also if you see any FVPG or any order block then you will have to
[12:55] we have to take the trade further. So now let me we are seeing any FVG here again. So look, But if you had taken this trade
[13:10] not have taken it. But even if you had taken it, your stop loss would have been hit at one place. But that stop loss would be very small in comparison to the profit you earned. So now after this let's go ahead and see if you can
[13:23] see any FVG anywhere here. So, you will see FVG many times in the middle you will see a trade after every FVG. But one thing we did not notice here was that our FVG was being formed here. But we had seen a sudden movement here even
[13:37] we can mark one of our order blocks. So this red candle that you see, we also mark it as an order block. For this, we come back here to the rectangle and after going to it, we take it from its high to its
[13:51] low and then extend it further. So look, we have marked our order block which is our red candle. Now after this, see, our order block was not eliminated anywhere and
[14:04] after that, see, this was such a point where we would have got entry again as per this order block and after that, if you see, your stop loss would have been this much but for the target, you know that you could have taken the target till your previous resistance
[14:18] and see exactly, the price had gone till there and by going there, you would have got your target. So in this way, if you first mark in the 4 hour time frame and then come to the 15 minute time frame, then the chances of your analysis
[14:31] turning out to be correct will increase significantly. Now look FVG if we say so, you will see a lot of times in the middle. But it is not necessary that after that you will see a trade and secondly if we look, you can see an FVG here also.
[14:43] After that you could get a trade again. The price goes exactly to your target but you may also get a stop loss. So in the FVG strategy, if you have a stop loss, it is very small. But the
[14:55] targets are very big. So, suppose you hit the target of 1:10 here even once, then even if you suffer five, six or seven consecutive losses, you will still remain in profit. So this is our complete method of earning money from trading.
[15:08] So this is a kind of revision and practical application of whatever I have taught you till now. So now let me teach you another important thing, which will greatly increase the accuracy of any sniper entry you take.
[15:20] And we call that thing HP Z i.e. High Probability Zone. So the high probability zone is basically that zone or that method in which the chances of your trade turning out to be correct will be higher. So for this
[15:36] I told you in the beginning that you have to look at two time frames, one is your HTF and the other is your LTF. HTF stands for Lower Time Frame. So if you do swing trading then your higher time
[15:51] frame can be one week. It could be one day. one hour. That means if you are using a higher time frame of one week then you can
[16:05] use a lower time frame of four hours. If one day is your higher time frame then one hour can be your lower time frame. Whose story is this? This is the thing about swing trading. Now in intraday trading, your higher time frame can be
[16:17] higher time frame can be 4 hours or 1 hour and in this case the lower time frame can be 15 am or 5 minutes. So if you are running for 4 hours then you can take the time frame of 15 minutes which we took. If you are
[16:30] running on one hour basis then you can take a time frame of 5 minutes. But this becomes very risky. Therefore, if you want to take intraday trade i.e. you want to take trade for a few hours and your trade gets over in 5-6 hours, then you should use this time
[16:42] I have already told you the time frame. But what is the high probability zone now? So the meaning of high probability zone or say high probability zone will be when the trend in both the time frames will be the same. That
[16:55] is, if suppose you have seen the higher time frame and in that you see that the market is bullish or the chart is bullish, then now the trade that you take in the lower time frame should also be bullish and when will you be able to take that bullish trade, you will be able to take it only when you can see that the
[17:10] chart is moving bullish. So if you see that both are bullish i.e. higher time frame and lower time frame, then we will say that this is our high probability zone, so you can take trade in it. But if you see
[17:24] that brother, our higher time frame is bullish. But the lower time frame is showing us that it is bearish. So in this case, this will not be our high probability zone but our low probability zone. And it is
[17:40] chances of you getting trapped will be higher. So if you enter the trade in this way, it will be a sniper entry in which your accuracy will increase. Secondly, your risk to reward ratio will be very high and thirdly,
[17:53] hope you liked this video. If you want to open an account to trade in crypto currency, then I have given you the link of Delta Exchange in the description and if you open an account in Delta Exchange using our link, then first of all you will get a discount on your trading fees
[18:06] given you the link of a Google form below. Also fill out that form so you will be eligible for our future giveaways. Apart from this, if you you can watch this playlist and if you want to
[18:23] learn about crypto trading in detail, then watch this video. Thank you.




⚡ Saved you 0h 18m reading this? Transcribe any YouTube video for free — no signup needed.