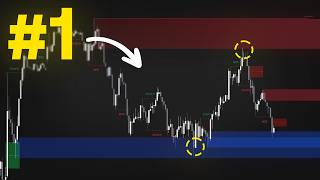

Top 10 TradingView Indicator Revealed
44sReveals a top-ranked free indicator, sparking curiosity and desire for an edge in trading.
▶ Play Clip"Title accurately describes the indicator as a top SMC tool, but 'greatest' is subjective; content delivers a thorough tutorial."
This video provides an in-depth tutorial on the Smart Money Concepts (SMC) indicator, a free and open-source tool on TradingView that ranks among the top 10 indicators. It explains how traders can use the indicator to analyze market structure, order blocks, liquidity, and fair value gaps to identify high-probability trade setups.
The Smart Money Concepts indicator is now among the top 10 indicators of all time on TradingView.
The indicator analyzes market structure, order blocks, and liquidity concepts.
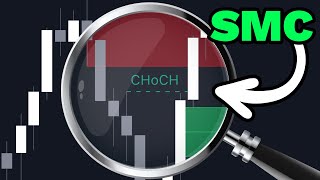
In an uptrend, higher highs and higher lows are expected. A break of a higher low triggers a 'Change of Character' (CHoCH) label, indicating a potential trend reversal. A break of a higher high triggers a 'Break of Structure' (BOS) label, confirming trend continuation.
Larger swing structures (solid lines) provide context for internal structures. An internal bearish CHoCH within a larger bullish swing may signal a less significant reversal.
The indicator detects equal highs/lows and major price levels (daily, weekly, monthly) to locate resting liquidity. Price often sweeps these levels before reversing.
Order blocks (bullish in blue, bearish in red) are areas of strong buying/selling activity. Fair value gaps (imbalances) are often filled and provide precise entry points.
The indicator includes a premium/discount feature based on equilibrium. For buy trades, waiting for a pullback below equilibrium can avoid stop-outs.
Blindly taking trades at CHoCH or BOS labels leads to failure. The indicator should be used with complementary tools for confirmation.
In a bearish structure with a larger bullish swing, volume analysis (Money Flow Profile) showed bullish sentiment at a key level. Price rejection and a higher low confirmed a bullish reversal.
In a bearish structure, price retraced into a swing order block above equilibrium. A bearish equal high and fair value gap provided a sell entry.
The indicator is free on five platforms. On TradingView, a candle coloring issue can be fixed by enabling candles in the layer panel. The premium version (Price Action Concepts Toolkit) adds volumetric data, multi-timeframe order blocks, trend lines, and chart patterns.
The Smart Money Concepts indicator is a powerful free tool for analyzing market structure, order blocks, and liquidity. However, traders must combine it with other analysis methods and avoid blindly following labels to achieve consistent success.
What does CHoCH stand for in Smart Money Concepts?
Change of Character
00:40
What does BOS stand for?
Break of Structure
00:52
What indicates a trend reversal in market structure?
A break of a higher low in an uptrend (CHoCH) or a break of a lower high in a downtrend.
00:40
What is the purpose of detecting equal highs and lows?
To locate areas of resting liquidity that price may sweep before reversing.
01:33
What are order blocks?
Areas of strong buying or selling activity where price often reacts.
02:11
How are fair value gaps used in trading?
They are imbalances that price tends to fill, providing precise entry points during retracements.
02:37
What is the premium/discount zone based on?
Equilibrium; price above equilibrium is premium (favoring sells), below is discount (favoring buys).
02:51
What common mistake do traders make with this indicator?
Blindly taking trades at CHoCH or BOS labels without confirmation from other tools.
03:17
What additional feature does the premium version (Price Action Concepts Toolkit) offer?
Volumetric data, multi-timeframe order blocks, trend lines, chart patterns, and several types of imbalances.
05:27
Top 10 Indicator
Establishes credibility and popularity of the tool being discussed.
00:02Market Structure Rules
Core concept that defines trend changes and continuations.
00:40Liquidity Sweeps
Key technique used by smart money to trigger stop losses before reversing.
01:33Blind Trading Pitfall
Critical warning that prevents traders from misusing the indicator.
03:17Volume Confirmation
Demonstrates how to combine SMC with volume analysis for higher probability setups.
03:43[00:02] smart money concepts indicator which became so popular that it now ranks within the top 10 indicators of all time on Trading View. By taking the most essential parts of smart money concepts, traders can finally perform analysis on
[00:15] market structure, order blocks, and liquidity concepts with a single indicator that is completely free and open- source. Today, we'll break down exactly how this gem works, and at the end of the video, show you the best
[00:28] features and setups to use in real markets to easily outsmart dumb money. Oh, you almost had it. You got to be quicker than that. At the foundation of this indicator is market structure. Structure is used as an easy way to
[00:40] detect trend changes and validate existing ones using price action. In an uptrend, the market makes higher highs and higher lows. But if a higher low point is broken, a red ch label which stands for change of character is
[00:52] plotted and this tells us the market direction has changed. However, if point, the previous higher high point is broken, it signifies that the market trend is continuing and a BOS label which stands for break of structure will
[01:06] be plotted. These labels are called realtime internal structures. However, these internal structures often exist within larger ones. If you zoom out, you'll see larger solid lines representing swing structures. These
[01:19] internal ones, but can be used to determine how significant a directional change may be. For example, you can have an internal bearish change of character created. But if it's within a larger bullish swing structure, it could be a
[01:33] sign that the trend change might not be as significant, and you may want to be cautious if holding trades for a long time in that direction. In addition to structure, the indicator can also detect equal highs and lows and major price
[01:45] points such as daily, weekly, and monthly levels. Traders will often use these levels together to locate areas of resting liquidity. In this example, an equal low is detected, suggesting that the price is struggling to go lower.
[01:58] Now, we can see that the price then swept that daily low, which might have It's then followed by a change of character at which point could then be traded into this order block above. Which also brings us to the next major
[02:11] part of this indicator, order blocks and fair value gaps. Order blocks are areas buying and selling activity. And when the price returns to these levels, there's often a strong reaction. The indicator will show you bullish order
[02:25] blocks in blue and bearish in red. And you can use these areas to take profit or exit your trades. Just like with market structure, you can detect more significant blocks by enabling swing order blocks. A trader may choose to use
[02:37] internal order blocks to enter trades and more significant swing order blocks as areas to exit. Fair value gaps can also be enabled and these are imbalances filled. Price will gravitate towards them and they're often used to find more
[02:51] precise areas within a retracement to enter a trade. The indicator also includes a premium and discount feature which can help detect regions of supply and demand in the market. So, if you're thinking about taking a buy trade, but
[03:03] the price is above the equilibrium, you may want to wait for a pullback to the you from getting stopped out in the retracement. These are the major of these features can be adjusted so traders can find just the right fit for
[03:17] their trading style. Since the release of this indicator, we've seen tons of videos and users attempting to use it by blindly taking trades at change of characters or break of structure points. If you blindly execute at these levels,
[03:30] you will inevitably fail as a trader. Traders are supposed to use this tool complimentary indicators before executing any trade. So, with that said, let's explore some of our favorite trade setups using this indicator. In this
[03:43] example, notice how the price is currently bearish. We know this from a bearish break of structure label. However, if we zoom out, we also see This could indicate that the current internal structure change may be a
[03:58] retracement of a much larger move. But if it is a retracement, when and where is it likely to reverse and continue bullish? Let's perform some volume analysis on this entire structure to determine that. Now any volume profile
[04:11] tool will work. But this volume tool not only shows where the most volume is but also whether traders have more bullish or bearish sentiment within that region. This indicator is the money flow profile and it's completely free. Now we see
[04:23] this price level. And also notice how there is significantly more bullish sentiment within that price region. Now as price trades into this level, we don't just execute, we wait to see its reaction to that level. And now that
[04:36] we're seeing larger bullish candles rejecting this level and also notice low, we now have quite a number of reasons to expect a bullish move from this region. In this other example, notice how the structure is bearish and
[04:49] the price has retraced into the swing order block. Now, if we enable premium and discount zones, we can see the price is above the equilibrium, which is where you want it to be for sell trades. We also see that there was a bearish equal
[05:01] high plotted, which is the first sign of a possible reversal. If we now enable fair value gaps, we can set a limit order at that fair value gap since the structure is still bearish to get an amazing sell trade. The smart money
[05:13] available for free on five different platforms. If using it on Trading View, a common issue with this indicator is that when candle coloring is enabled, it only changes the colors if the indicator is selected. An easy way to solve this
[05:27] candles in the layer panel. This issue was fixed in the premium version of this indicator. the price action concepts toolkit. We also improved the order blocks to provide volutric data, multi-time frame order blocks, trend
[05:40] lines, chart patterns, several different types of imbalances, and much more. This version of the indicator is constantly updated as we integrate new features based on user feedback, and you can try it for 30 days at luxalgo.com.
[05:53] We hope you enjoyed this video and now have a better understanding of how to to this indicator for free within the Luxalgo library by searching Smart Money what indicator you would like us to cover next. And don't forget to join our
[06:08] Discord community to provide feedback. Thank you for watching and until next Thank you for watching and until next time.
⚡ Saved you 0h 06m reading this? Transcribe any YouTube video for free — no signup needed.