
Selling Strength Signal: Candle Breakdown
45sTeaches a clear, actionable candlestick pattern for spotting selling pressure, which is highly sought-after by traders.
▶ Play Clip"The title is generic and the content is a brief, basic chart analysis—delivers some value but lacks depth."
This video provides a concise technical analysis of price action, focusing on candlestick patterns, selling strength, and buyer sustainability. The speaker demonstrates how to identify consolidation phases and uses Fibonacci retracement to predict potential market movements.
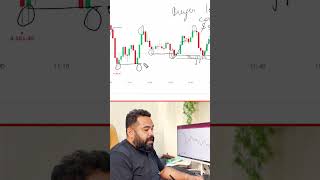
A selling candle closes below the previous candle's low, and the next candle does the same, indicating growing selling strength.
During consolidation, buying candles lack strength, and upper wick candles form, showing weak buyer presence.
Selling continues as each candle closes below the previous low, but eventually buyers arrive and sustain above the high.
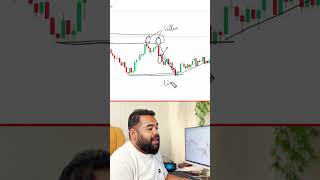
Drawing Fibonacci from the swing low to high reveals the Golden Phantom Zone, suggesting the market will move upward from this area.
The video teaches how to read candlestick patterns to gauge selling and buying strength, and how to use Fibonacci retracement to identify potential reversal zones. The key takeaway is to wait for buyer sustainability and use the Golden Phantom Zone as a bullish signal.
What does a selling candle closing below the previous candle's low indicate?
It indicates growing selling strength.
What pattern shows weak buyer strength during consolidation?
Upper wick candles with no strength in buying candles.
00:16
What signals a potential reversal after selling?
Buyers arriving and sustaining above the high.
00:28
What is the Golden Phantom Zone?
A Fibonacci retracement area that suggests the market will move upward.
00:42
Selling Strength Confirmation
Provides a clear, actionable pattern for identifying selling pressure.
Buyer Sustainability
Emphasizes the importance of waiting for buyer confirmation before entering.
00:28Golden Phantom Zone
Introduces a specific Fibonacci-based bullish signal.
00:42[00:00] इस selling candle को ध्यान से देखो, इस candle ने previous candle के low के नीचे closing दी, same as candle ने भी किया, मतलब selling strength grow हो रही है, अब यहाँ पर देखे, seller तो sustain कर रहे हैं, लेकिन जैसे ही यह buyer आया, यह buyer तुरंथ ही अगले candle में dilute हो गया,
[00:16] अब यहां से पूरी consolidation को देखना किसी भी consolidation के buying candle में strength नहीं है upper wick वाली candles बन रही है अब यहां पे strength नहीं दिख रही है buyers की
[00:28] यहां से अगर मैं selling वापिस से देखू तो विर्ष से एक-एक candle previous candle के low के नीचे closing दे रहा है अब यह देखिए finally buyers आ गए buyer sustain भी कर रहे हैं high के उपर buyer sustain करने लगे हैं
[00:42] अब अगर मैं यहां से लेकर यहां तक fibonacci draw करूँ तो इसी area में golden phantom zone भी draw होता है अब यहां से market वापिस से उपर चला जाएगा

⚡ Saved you time reading this? Transcribe any YouTube video for free — no signup needed.