
ICT 2022 Mentorship: The Secret Retail Traders Miss
45sTaps into the hype around ICT and smart money concepts, promising insider knowledge.
▶ Play Clip"Delivers on the promise of a simple SMC strategy with a backtest, but the 'cool trick' is a minor feature and the title oversells the 'highly effective' claim."
This video presents a simple yet effective trading strategy based on Smart Money Concepts (SMC), using two TradingView indicators: LuxAlgo's Smart Money Concepts and Puffer's Market Bias. The strategy involves identifying a Change of Character (CHOP) followed by a Break of Structure (BOS) in alignment with the market bias, with a backtest showing a 61% win rate and a profit factor of 3.17 over 150 trades. The video also demonstrates a trick to extend historical data on TradingView by up to three times using Bar Replay.
The video introduces a trading strategy based on Smart Money Concepts (SMC), popularized by ICT's 2022 mentorship. It promises a simple, effective approach and a backtest of 150 trades with a 1:2 risk-reward ratio on the 1-minute timeframe.
Use the LuxAlgo 'Smart Money Concepts' indicator on TradingView. In settings, uncheck specific options to focus on two features: Change of Character (CHOP) and Break of Structure (BOS). Green labels indicate bullish structure, red labels bearish.
Add the 'Market Bias' indicator by Puffer. Set the period to 60 and moving to 10. Adjust the style to set background opacity to 30. This indicator acts as a trend filter: green zone for long trades, red zone for short trades.
For a long trade, the CHOP label must appear in the red zone (downtrend) and the BOS label in the green zone (uptrend). This is the only condition. Set stop loss below the most recent swing low and take profit at 2 times the risk.
For a short trade, the CHOP label must be in the green zone (uptrend) and the BOS label in the red zone (downtrend). Set stop loss above the most recent swing high and take profit at 2 times the risk.
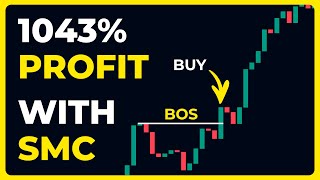
Backtested 150 trades with a 1:2 risk-reward ratio on a $1000 account risking 2% per trade. Results: 61% win rate, 1043% gain, profit factor of 3.17, 7 consecutive wins, 4 consecutive losses, and a maximum drawdown of 7.87%.
On paid TradingView plans, use Bar Replay to extend data. Jump to the last available bar, activate Bar Replay, and click on that bar to unlock two more weeks of data. This can be repeated up to three times, giving a total of six extra weeks.
The strategy is simple and backtests well, but traders should verify it in live conditions. The data extension trick is a valuable tool for backtesting on lower timeframes.
What are the two indicators used in this strategy?
LuxAlgo's Smart Money Concepts and Puffer's Market Bias.
01:14
What does CHOP stand for and what does it indicate?
Change of Character, indicating a potential trend reversal.
02:12
What is the entry condition for a long trade?
CHOP label in the red zone and BOS label in the green zone.
04:03
What is the risk-reward ratio used in the backtest?
1:2 (risk 1, take profit 2).
07:48
What was the win rate in the backtest?
61%.
08:22
What is the profit factor from the backtest?
3.17.
08:22
How many times can you use Bar Replay to extend data?
Three times.
10:20
What is the maximum drawdown in the backtest?
7.87%.
08:22
Simple Entry Condition
The strategy's simplicity is its core appeal, requiring only one condition for entry.
04:03Backtest Performance
The backtest shows a high win rate and profit factor, suggesting the strategy's potential effectiveness.
08:22Data Extension Trick
This trick is a practical solution for backtesting on lower timeframes with limited data.
08:38[00:00] For over 10 years, retail traders have been looking for ways to trade and make money using smart money concepts. Earlier this year, ICT launched their 2022 mentorship program, and the philosophy of
[00:13] trading led to banks has only gained enormous popularity since then. In this video, we will explore a simple but highly effective trading strategy that's deeply rooted in the philosophy of smart money concepts.
[00:26] Later in the video, we will also backtest this particular strategy 150 times using a risk to reward ratio of 1 to 2 on the 1 minute time frame. The backtesting software I'm going to be using is called Traderage.
[00:41] I'll leave a link in the description. Let's get into it. Now, as you may already know, trading to you doesn't give you a lot of chart data on the 1 minute time frame. So now the question is, how exactly am I going to find this 150 trades for backtesting when
[00:56] the one minute time frame has only two weeks of data. Well if you stick to the end of the video I'm gonna show you a cool trick that you can use to get up to three times more data on the one minute time frame on your trading group. This trick actually works on any time frame not just
[01:14] the one minute time frame so be sure to stick to the end for exactly that. Now for this type of thing I'm going to be using the EURUSD on the one minute time frame but you can do this strategy on any security that you like to trade. Head over to the indicators search tab and type in smart
[01:30] money concepts. Be sure to select this one by LuxAlgo. You can have the access to the indicator settings to make some changes. To do that click right here and on the inputs tab uncheck the
[01:42] following options exactly like I'm doing right now. The LuxAlgo smart money concepts indicator is a highly accurate tool designed to provide real-time analysis of market structure and
[01:58] activity. It includes a range of features relevant to S&P, such as break of structure labeled as BOS, change of character labeled as CHOP, bullish and bearish order block,
[02:12] equal highs and equal lows, fair value gap detection, previous highs and lows, etc. We're obviously not gonna be using all of this indicator's features, just two of them. That is, change of character and break of structure.
[02:27] To take a long trade, we're gonna wait for a bullish change of character to form, followed by a bullish break of structure, and then we're gonna enter the trade on this candle right here.
[02:40] Now you may be wondering how do I know it a bullish change of character or a bullish break of structure Well when both the dotted line and the text are green that is a bullish market structure
[02:52] label. Like this one right here. You see, the text and the dotted line are all green. But when the line and the text are red, like here, that becomes a bearish market structure
[03:04] label. Speaking of bearish, how do we take a short trade? we're going to take a short break when there is a bearish change of character labeled as Choc followed by a bearish break of structure labeled as BOS, like right here.
[03:19] Now for the second indicator, head back to the indicators first tab and type in market bias. Be sure to select this one by Puffer for X. Again we're going to access this indicator settings by clicking right here and on the inputs tab change the
[03:34] period to 60 and then change this moving to 10. After that head over to the style tab and uncheck this option right here. Then here on the plot's background click on its color and change the
[03:47] opacity to 30. After that click ok. This indicator will be our trend identifier. When it's green we only take long trades. When it's red we only take short trades. Now let's go over the conditions for
[04:03] entering trade. To enter a long trade, first, the smart money concept indicator should print a bullish changes character in a downtrend followed by a bullish breakout structure in an uptrend. What I mean by this is that this top label should be within the red zone of
[04:22] the market bias indicator while the BLS label should be within the green zone of the market bias indicator. Second, there actually isn't any other condition, it's just that one condition
[04:37] we've already talked about. That's how simple this strategy is. All entry conditions are met on this channel, so we're gonna enter a long trade. The stop loss is gonna be set below the most recent string low, which is this one right here, and for the take profit, we're gonna set
[04:53] it at two times the risk. We let this trade run and fold it in. Now here's another example. As you can see here, Charles label in the red zone, DOS label in the green zone. So we enter a long
[05:10] trade here. Set our top loss below the most recent stream low, which is this one right here, and to take profit we gonna set it at two times the risk We let this trade run and Here one more example Stock label in the red zone BOS label in the green zone We enter a long trade here set our stock price below the most recent swing low which is this one right here
[05:37] We enter the dead profit, we're gonna set it at two times the risk. We let the trade run, and full tipping. Now I know sometimes things can be complicated. Now what you want to remember is that for a long trade,
[05:51] trade, the chalk label should be within the red zone and the BOS label should be within the green zone. I repeat, chalk label in the red zone, BOS label in the green zone. Now, you may be asking
[06:06] yourself, but what are the conditions for entering a short trade? Well, we're gonna do the opposite of everything we did for a long trade. First, the smart money concepts indicator should print a bearish change of character and a bullish trend, followed by a bearish break of structure
[06:22] in a downtrend. Again, what I mean by this is that this chart label should be within the green zone of the market bias indicator, while the BOS label should be within the red zone of the market
[06:36] bias indicator. Second, oh, I forgot, no other conditions, just the one. Our entry condition is met on this candle, so we enter a short trade.
[06:48] We're going to set our top loss above the most recent swing high, which is this one right here, and the take profit we're going to set it at 2.10. We let the trade run and pull the tip in.
[07:02] Now here's another example. As you can see here, CHOP label in the green zone, BOS label in the red zone. So we enter a short trade here. Set our stop loss above the most recent swing high, which is this one right here.
[07:16] And to protect profit, we're gonna set it at 2 cents per risk. We let this trade run. And fold it in. Here's one more example. Stock label in the green zone.
[07:30] BOS label in the red zone. We enter a short trade here. Set our stop loss above the most recent swing high, which is this one right here. for the take profit we're gonna set it at two times the risk. We let this trade run and hold it in.
[07:48] Now the most important question. How exactly does this strategy perform in different market conditions? Well to answer that I'm going to do a backtest with 150 trades using a risk to reward ratio of
[08:00] one to two. The account set is going to be set at a thousand dollars and we're going to be risking 2 of that every time we take a trade Let get into it After 150 trades we see that the win rate of this strategy was 61 and the gain on the account was a 1043 These numbers are really good for risk to reward ratio of 1 to 2
[08:22] We see that it has an amazing profit factor of 3.17, 7 consecutive wins against 4 consecutive losses and a maximum drawdown of 7.87%. Also, the backcasting for this strategy took 5 weeks.
[08:38] So the trick that I promised in the beginning of the video, you know, the one that you can do to get up to 3 times more data on this chart, works like this. First, you have to be on any of the paid trading view plans. Then you're going to go through your time jump rule and jump as far back as possible.
[08:53] Basically, you want to get to the end of the data that has already been provided by trading view. For me, I'm on a pro plane, so I'm gonna jump as far back as possible, maybe to this
[09:05] bit. Now, as you can see here, I'm at the very end of the data that I already have on my pro plane. To access more data, you basically go in Activate Bar Replay, like this, and then you click
[09:18] on this last bar right here, and then boom, here you go. Now I have two more weeks of data right here if I scroll to the left. Now if you want more data, we do the exact same thing we did before and it's gonna give
[09:32] us two more weeks of data. So we're gonna jump all the way back and as you can see here, this is the last candle. So what we do is we again activate the bar replay on this very last candle right here
[09:48] and just like before, there you go, more data. And the cool thing is, we can do it again. So, we're going to jump as far back as possible, again, to the very last bar. And right here again, we activate the bar replay on the last channel.
[10:05] And just like that, we have three times more data than before. Now, you may be asking yourself, Can we jump as far back as possible, maybe all the way to the beginning of time? Well, no. We can jump back in time only three times.
[10:20] Why only three times? I have no idea. Now the three time gems that we did have given me a total of six weeks of chart data. Add that to the two weeks of data I already have and that's two months of data right there.
[10:33] So if you have, let's say, a one-minute strategy where you need to backtrack on more than just two weeks of data on TradingView, then you're welcome. If you liked this video, hit the like button below and don't forget to subscribe in this channel.
[10:46] That's been it. Thanks for watching and I'll see you guys next time.
⚡ Saved you 0h 10m reading this? Transcribe any YouTube video for free — no signup needed.