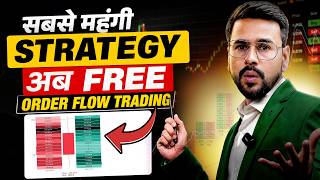

The Strategy That Won the Robbins Cup
40sHigh curiosity and credibility by referencing a major trading championship win.
▶ Play Clip"Title accurately promises a masterclass on order flow for beginners, and the video delivers detailed explanations and chart examples."
This video provides a comprehensive masterclass on order flow trading, explaining how to analyze buy and sell orders to detect institutional activity and predict market reversals. The presenter covers key concepts like auction market theory, market vs. limit orders, delta, absorption, and exhaustion, with practical chart examples.
The order flow strategy was used by the winner of the Robbins Cup, a year-long trading championship where the trader with the highest returns wins.
Order flow shows how many buy and sell orders are in the market. More buyers than sellers push price up; more sellers than buyers push price down.
The market is like an auction where buyers bid and sellers ask. A fair price is reached when a deal is made. The three stages are balance, imbalance, and new balance.
Market orders are aggressive and take liquidity immediately at the current price. Limit orders are passive and provide pending liquidity, executed only when price reaches the set level.
Numbers on the chart show buy and sell orders at each price level. Darker colors indicate more orders. Delta is the difference between buy and sell orders (buy orders minus sell orders).
If price rises but delta weakens (becomes less positive or negative), it signals a potential bearish reversal. If price falls but delta strengthens (becomes less negative or positive), it signals a potential bullish reversal.
Absorption occurs when aggressive market orders are absorbed by a large limit order wall, preventing price movement. This often leads to a reversal in the opposite direction.
Exhaustion happens when the inflow of new aggressive orders reduces significantly. Buy exhaustion after an uptrend suggests a bearish reversal; sell exhaustion after a downtrend suggests a bullish reversal.
Order flow analysis provides deep insights into market dynamics by revealing institutional order placement. Combining it with price action and smart money concepts can significantly improve trading decisions.
What is order flow?
Order flow shows how many buy and sell orders are in the market at each price level.
00:42
What are the three stages of auction market theory?
Balance, imbalance, and new balance.
02:54
What is the difference between a market order and a limit order?
A market order executes immediately at the current price (aggressive), while a limit order executes only when the price reaches a specified level (passive).
06:29
What does delta represent?
Delta is the difference between buy orders and sell orders (buy orders minus sell orders).
10:18
How can you detect a bearish reversal using delta?
If the price is rising but delta is weakening (becoming less positive or more negative), it signals a potential bearish reversal.
12:12
What is absorption in order flow?
Absorption occurs when aggressive market orders are absorbed by a large limit order wall, preventing price movement and often leading to a reversal.
14:23
What is exhaustion in order flow?
Exhaustion happens when the inflow of new aggressive orders reduces significantly after a trend, indicating a potential reversal.
16:10
What does a positive delta indicate?
A positive delta indicates more buy orders than sell orders.
10:49
What does a negative delta indicate?
A negative delta indicates more sell orders than buy orders.
11:16
What is the significance of dark colors on the order flow chart?
Dark colors indicate a higher concentration of orders at that price level.
09:50
Championship-Winning Strategy
The order flow strategy was used by the winner of the Robbins Cup, proving its effectiveness in real trading competitions.
00:02Auction Market Theory Explained
Provides a foundational understanding of how price moves through balance and imbalance, essential for order flow analysis.
02:27Market vs Limit Orders
Clarifies the difference between aggressive and passive orders, which is crucial for interpreting order flow data correctly.
06:29Delta Divergence for Reversals
A practical technique to spot potential reversals by comparing price action with delta strength.
12:12Absorption and Exhaustion
Key concepts to identify when large players are absorbing orders or when the trend is losing momentum, leading to reversals.
14:23[00:02] called order flow. And it's so useful that the strategy that's created based on it , the traders who used it [music] have won the Robinhood Cup. For Robbins Cup is a type of trading
[00:14] championship in which traders are monitored for a year and the one who earns the highest returns wins that championship and the trader who won that championship was using this strategy. So in today's
[00:26] So let's start this video. different types of candles that we are seeing are what we are calling order flow. What is this after all? So order flow basically tells us how many buy
[00:42] and sell orders are there in the market. Now why is this so important? This is so important because if there are more buyers and fewer sellers in the market, then you know the price increases. If there are more sellers and fewer buyers in the market,
[00:55] you know that the price falls. So this is the raw data on the basis of which charts are made later. Because only those orders which are executed will be visible in your candle. That is, in the order flow, we analyze buy-sell orders
[01:08] so that we can see the institutional activity first. That is, to see the orders that are being placed in the market in the form of numbers from the exact place where those orders are being placed is called order
[01:21] flow analysis. So these numbers that you see next to the candles, there is a you look carefully, you will see that the same green candle is in the middle. But these numbers that we see next to it are
[01:34] numbers. The number of orders placed in the market. How many buy orders are there, how many sell orders are there? We can see this here. So if we combine this order flow with our smart money analysis, which looks at liquidity and
[01:47] market structure, then But for this you will have to understand a little bit first and I would tell you to watch this video very carefully. If you watch it while walking then you
[02:01] you will come to know many such things which you might not have heard before. Therefore, you have to watch this video with a lot of patience and if you like the video subscribe to the channel and definitely tell us by commenting from where you are watching this video.
[02:15] So now before understanding this order flow, there is a concept which is very important for you to understand. If you do not clear it then in a way the base itself will not be clear to you and then you will not understand this thing and that thing is
[02:27] auction market theory. So auction market theory says that the market is like an auction where the buyers always keep bidding and the sellers keep asking and when a deal is made between them and both
[02:41] reach a price, then it is called fair price and when a fair price is made then a deal is made between the two. That is, what is Bud and Ask running for? A fair price is underway to determine the price. Now this auction
[02:54] basically has three stages. The first stage is balance in which you see that suppose this is a property which is available for ₹100 and you are ready to sell it for ₹100. That means there is a balance between us here.
[03:08] Either someone is buying it for Rs 100. The other one is selling for around 100. Then he is buying it for Rs 100. price here between 1000 and 101 is fluctuating up and down. So what is this? This is called balance in the market. But this balance will not last forever. At
[03:22] some point or the other, there will be an imbalance in the market and only when there is an imbalance, the prices in the market increase. If there is balance in the market, everyone is buying for Rs 100 and selling for Rs 101. If you are buying it for Rs 101 and selling it for Rs 100 then the price will never increase. Sometimes there is an
[03:35] imbalance in the market due to which the prices increase. When the balance buying for Rs 100, selling for Rs 101, buying for Rs 101 , selling for Rs 100. This was going on. But suddenly, suppose this is a property, then news comes that
[03:48] brother, a highway is going to pass in front of this property. Now as soon as this news comes that a good people will come here and say, I will buy it for Rs 100, I will buy it, I will buy it, everyone will come to buy, so there will be more buyers, then the seller will become bold and say,
[04:01] why will I sell it for Rs 100, now I will sell it for Rs 300. That is, what happened here was that suddenly there was a demand and because of some reason an imbalance was created in the market due to which the price increased and reached directly to ₹300. So we call this
[04:15] imbalance in which the number of sellers remained the same but suddenly a lot of buyers came. So an imbalance was created in the market. So he started planting more and more buds. Due to which the price increased directly to 300 or we can say that the seller started
[04:29] asking more. Due to which the price has increased. So the reason behind the increase in price or the biggest reason behind the fall in price is the biggest reason behind the fall in price is the
[04:42] is created, only then the price increases. If there is balance in the market then the price will not increase. So now when the news of the construction of the highway came, the price reached ₹300. So then a new balance has been created here. In which again there will be a buyer
[04:56] who will say yes I will buy it for Rs 300. The other one will say, okay, sell it for Rs 300. So I will also take it. So this is how the deal is going on between the two. 300 305 310 The rate continues like this. But now again, if some positive news comes then the
[05:10] price will increase and imbalance will be created again. But this time a negative news comes. It turns out that the news that a highway is going to pass from here is true. That was a fake news. Now as soon as this news reaches the market, the seller here will say, hey
[05:23] Now the buyer knows. He will say brother, I will not buy it for Rs 300. If he is giving it for Rs 200 then let me think about it. So the seller there gets ready to sell it for Rs 200 and because of this what happens here? Then the
[05:36] price here falls because an imbalance is created. This sudden move that you are seeing is due to imbalance and this time the imbalance has created, at this time the buyers have reduced but the sellers have
[05:49] increased. He is very aggressive in selling. Due to which the price has fallen here because again an imbalance has occurred. And when imbalance comes again, then again we get to see a new balance here. In which the price has
[06:03] reached ₹200 and again the price keeps rotating in this manner. That means, now you must have understood how the price is moving and this cycle of balance and imbalance continues in the market. and this cycle of balance and imbalance continues in the market.
[06:17] theory. So let us now talk about those components of order flow without which it is very difficult to understand order flow and again you will be very confused in this if you do not watch this video carefully. So the first
[06:29] component that you need to understand here, and you probably already know it, is market order versus limit order. Now it is very important to understand this here because if you do not understand this and you consider all the orders to be the same, then what will happen is that
[06:42] you will get confused and you can take wrong decisions. So now let us clarify what a market order is? So, I have already told you what it means when you take a trade on a market order ?
[06:54] Whatever price is prevailing in the market at that time, you you are an aggressive buyer who is taking liquidity from the market. Which we also call taker because you have taken liquidity here. Whereas if you execute your
[07:10] Here is what you will see on Delta Exchange if you execute a trade through a limit order. What does it mean? That you have decided on a particular price. The price at which you will execute your trade.
[07:23] If the price reaches that level then your trade will be executed. If the price does not reach that level then the trade will not be executed. So what's going on with the limit order If the price comes, the trade will be executed. Whereas in a market order,
[07:35] we are ready to buy at whatever price is prevailing at that time. This if you are placing a market order, it means you are an aggressive buyer or seller. And aggressive buyer or seller means that if suppose a buyer or
[07:48] seller is taking a lot of quantity then there may be some big reason behind it. Whereas if someone has placed a limit order, then here it is a pending liquidity and when the price comes to it, then that liquidity will be used. Now let's go straight to the chart and
[08:03] understand it there. But before that, if you I personally use Delta Exchange. And if you open your account using our link, you will
[08:16] We will also add you to our Twitter channel. But for that, after opening the account from our link, you must fill the Google form. So to place the order flow chart, first of all you have to go to Trading View and after going there
[08:28] you get the option of which type of chart you want to see. So here you can see visible below. You have to click on this. As soon as you click on this, your chart will appear to you like this. So now when you
[08:42] zoom here, you will be able to see these orders. But here you cannot see that well. Therefore, you will have to change some settings of this chart. Now I will also show you what changes need to be made in those settings.
[08:55] here. You can apply the same settings to your chart as well. And after that we have to click on OK here. So, as soon as we click on this, now you can see that the chart in front of you
[09:09] you can also see the order flow here on the side. So, once you have done these settings, then look at these numbers that you are seeing here, let us understand what they mean. So these numbers are basically the orders that are
[09:22] placed in the market at that particular price. For example, if we look here, we see that there are 623 buy orders and 432 sell orders. orders and 432 sell orders. Whereas at this place there are 65,000 sell
[09:35] orders and 65,000 buy orders also. Here we are seeing some difference in the orders. Apart from this, the darkest color that you you see, gets the most orders. That means there are 1,12,000
[09:50] buy orders here. 98,000 There are orders to sell here. So here we are getting to know the orders and dark color means there are more orders. Light color means there are fewer orders. Apart from this, if you look here, we can see one more thing
[10:05] and that is below every candle which we call Delta. Now what is delta? Before you understand that, look below. The total is also written here. So total means how many orders are there in this candle? Be it buy
[10:18] orders on this side. Sell orders are visible on this side. And the total orders are visible here. And after this, let us talk about Delta, what is this Delta after all? So delta tells us the difference between buy orders and sell orders.
[10:33] [Music] So, let's say there are 100 buy orders and 90 sell orders in the market. So this delta will be 10. Whereas, suppose you see that there are 100 buy orders in the market but 110 are sell
[10:49] orders. So this delta that you will see will be -10, that is, according to mathematics, if we look at the formula of delta, it is buy orders minus sell orders. So right now this number is positive. It is green. What does it mean? This means there
[11:04] are more buy orders here. Similarly, here also you can see that there were more buy orders in this candle. There were more buy orders in this candle also because the delta was positive, green. Here too there were more buy orders. But here you can see that there were
[11:16] less buy orders and more sell orders. Because we're seeing a delta of -29,000 here. Meaning there are more sell orders here. Now, do more sell orders, which means the price will fall.
[11:30] This is like a gold mine in our hands. It does n't work like that. We can use it in other ways also. Because I had told you one thing about limit orders, it is possible that there may be more limit orders at that place. So those orders will not necessarily be
[11:45] executed. They are engaged in the market on orders. Due to which you will get confused and understand that brother, there are more orders here. It is possible that out of those 500 orders, which we see here, the delta of 19,000,
[11:58] possible that it is actually negative but it appears positive to us because those orders are not going to be executed right now. Therefore, we should not reach a conclusion immediately. So how do we use it now? Let us understand this.
[12:12] So the first thing you can use is order flow to detect reversals in the market. But how will we know that? So for this we have to look at delta. If you ever see that the price is increasing but the delta is getting weaker.
[12:25] So if the price is rising and the delta is getting weak then it means that there are chances of the price falling from here. For example, here you can see an example where there was a example, here you can see an example where there was a positive delta of 3400. But
[12:37] after that the delta came down to 67000. Whereas the price has increased. After that the delta Whereas the price has increased. After that the delta not fall much. That is, in a way, what we saw was that the delta is
[12:52] weakening. First from 3400 straight to 67000 and then straight to 241000 while the price is increasing in this time frame. So the price is increasing but the delta is weakening. So this means that there are chances of price falling here. This
[13:07] tells us a reversal. Now I am not saying that brother, you went straight and saw this and shorted it there. You also add your price action. You should also use your smart money concepts. Use SPG and if you
[13:20] see this along with it then it can become a game changer. So if you had noticed this, you would have seen that the price in the very next candle had price in the very next candle had fallen a lot and the delta here was -2.19
[13:33] million. So if you had entered at this place, you can see here that the price had fallen significantly. And once you have seen the order flow, it is not necessary to keep placing the same candle. What can you do in that place? You
[13:45] can also put your normal candles. [MUSIC] But you understand how to use it. So now let's see how to do it if you want to find the second reversal. Secondly, suppose you ever see that the price is
[13:57] continuously falling. But the delta is becoming stronger. Meaning, let's say the first delta was very negative. Then it became a little less negative and then started becoming positive. Then I started becoming more positive. While the price was falling in it.
[14:10] So here we understand that the buy orders are increasing at this time. That means there are chances of price increase after this. But again, if you combine this with ICT concepts or price action,
[14:23] next concept you have to understand is absorption versus absorption. What is absorption? First of all let us understand. Suppose the buyers are continuously buying in market orders. But there is a big limit order placed at that place
[14:37] which is a sell order. So now whatever buyers are bringing orders, all those orders are getting absorbed here. Meaning, in a way, imbalance is not being created. So because of this the prices are not increasing here. So at this
[14:50] point we can say that there are chances of the price falling from here. There are orders that will come will definitely bring down the price. So, in a way, the chances of a bearish reversal increase here. On the contrary, if you ever see
[15:05] that the sellers who are there continuously are selling in market orders. But if there is a big buy limit order placed there, then executed. Due to which the price is not falling. So in such a situation, there are
[15:20] chances of the price increasing now. That means a bullish reversal could come from here. Now how will this appear on the chart? So suppose you see that the volume has increased a lot. Delta is either very positive or very
[15:32] negative but there is no significant movement in the price. So if the delta is high but the price is not moving, then it means that there is a wall of some limit order which is absorbing all the orders. So
[15:46] what happens in such a situation? We see a small candle or a candle with a long wick because as soon as the sell order comes, it absorbs a huge wall of buy limit orders or a very large order, then the
[15:58] price comes down and then suddenly rises up again, so a wick is seen or small candles are seen. One such similar concept is exhaustion. If you ever notice that the number of new buy orders or new sell orders coming in has
[16:10] reduced significantly or the aggressive orders have stopped coming in, then this is called exhaustion. Now what will happen by exhaustion? If, for example, there is an uptrend and then the inflow of new orders reduces, then this will be called buy exhaustion and there are chances of the price falling from here.
[16:25] And what will cell exhaustion be ? Suppose after a downtrend, you see that the number of new sell orders has reduced. So this means that now the sellers are exhausted and from here there will be chances of the price increasing.
[16:38] So this will happen in the chart when you see that after the up trend, suppose there was an uptrend and after the up trend, you see that brother, this volume has reduced a lot. But what now ? Now the delta has also reduced. So this
[16:51] means that the bearers here have been exhausted. There will be chances of the price falling. If you see that after the down trend, the volume has started decreasing. Along with this, the delta has also started decreasing. So this means that the sellers are
[17:03] now tired and there will be chances of the price increasing from here. So these are some ways you can use order flow. Order flow is a very broad concept. There are many things involved in this. Even I would tell you that this data is
[17:16] very expensive and this chart that I am showing you is also a you can see this data here. If you use the free version of TradingView, then you will not be able to see these charts. And the other websites
[17:29] where this data is visible and appears more accurate also come at a premium. So if you want us to make another video on order flow, link is given in the description, please open it from there. If you have opened it through our link, then
[17:43] which you get Telegram access and also a subscription of Ara AI worth ₹2000. please subscribe to us and if you
[17:55] want to learn trading from very basic to advanced then you can watch this entire playlist by clicking here. Thank you.




⚡ Saved you 0h 17m reading this? Transcribe any YouTube video for free — no signup needed.