
What Is a Breaker? The Logic Behind It
45sExplains a popular trading concept with clear logic, appealing to traders seeking deeper knowledge.
▶ Play Clip"Delivers a thorough, structured breakdown of the breaker concept with actionable strategies, though some filler and self-promotion."
This video provides a comprehensive guide to the Smart Money Concepts (SMC) 'breaker' pattern, explaining its formation, logic, and trading strategies. It covers entry techniques, stop-loss placement, take-profit targets, and a checklist for high-quality setups, with practical examples on multiple timeframes.
The video is a deep dive into the breaker, a key tool in Smart Money Concepts. It promises to cover logic, formation, trading entries, stop-losses, and targets.
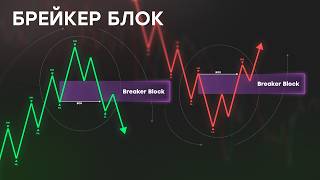
A breaker is formed at a trend change, unlike order blocks or imbalances. It signals a shift from uptrend to downtrend or vice versa.
Formation requires a significant institutional support zone on higher timeframe, a bearish order block at the extreme low, and an impulse breakout that turns it bullish. The price returns to test the broken level.
It's a classic bear trap: smart money creates a false breakout to fill buy orders and build liquidity, triggering stop-losses and causing uninformed traders to sell, leading to a revaluation upward.
Price must consolidate above the broken swing (candle body close above) to confirm the breaker. If only a sweep occurs (body closes below), the breaker is invalid.
The upper point is the extremum of the broken swing; the lower point is the minimum of the bearish order block. The lower boundary is used for aggressive stop-loss placement.
Correct range selection considers the swing extreme formed by a rising candle, includes candle shadows, and respects the logic of the breaker.
Basic entry is a limit order at the start of the breaker. Aggressive stop-loss is used only if the range minimum coincides with the impulse candle's minimum; otherwise, conservative stop is preferred.
Second entry: from the full fill level of the imbalance (bullish inefficiency) within the breaker. Third: from the beginning of the imbalance if not fully filled. Fourth: using volume profile to place limit order at the least traded volume level.
Use higher timeframe (e.g., weekly) to identify support/resistance zones and targets, and lower timeframe (e.g., daily) to confirm reversal with a bullish breaker.
Instead of one take-profit, split into 3-4 targets at intermediate problem areas and liquidity pools. Example distribution: 30%, 20%, 50% or 25%, 50%, 25%.
Mirror image of bullish: formed at resistance zone, price breaks below swing, closing body below confirms. Entries and stop-losses are analogous.
On hourly timeframe, identify resistance zone (upper block) and imbalance as target. On 15-minute, find bearish breaker, set limit order at fill level, conservative stop, and take-profit at imbalance.
The breaker is a powerful Smart Money tool for identifying trend reversals and trading with high probability. Mastery requires understanding its formation, confirmation, and multi-timeframe analysis, along with disciplined risk management.
What is the key difference between a breaker and an order block?
A breaker is formed at the moment of a trend change, while an order block is not necessarily.
00:43
What are the three structural elements required for a bullish breaker formation?
LOW, Loverха, and one more ll (five-candle swings).
01:13
What is the logic behind a breaker?
It's a classic bear trap: smart money creates a false breakout to fill buy orders and build liquidity, triggering stop-losses and causing uninformed traders to sell.
01:53
What confirms a bullish breaker?
The candle body must close above the broken swing (consolidation above).
03:15
How do you determine the upper and lower points of a breaker range?
Upper point is the extremum of the broken swing; lower point is the minimum of the bearish order block.
03:41
When is an aggressive stop-loss appropriate?
Only if the range minimum coincides with the minimum of the impulse candle that broke the structural top.
05:25
What are the four key entry methods for a breaker?
1) Limit order at the start, 2) Full fill level of imbalance, 3) Beginning of imbalance if not fully filled, 4) Volume profile least traded volume level.
05:12
How should take-profits be managed?
Split into 3-4 take-profits at intermediate problem areas and liquidity pools, e.g., 30%, 20%, 50%.
08:37
Bear Trap Logic
Explains the core mechanism of smart money manipulation behind the breaker, making it a powerful insight.
01:53Confirmation Rule
Provides a clear, actionable rule for validating a breaker, crucial for avoiding false signals.
03:15Imbalance Entry
Introduces a refined entry using the imbalance fill level, improving risk/reward.
05:38Multiple Take-Profits
Highlights the importance of scaling out to capture partial moves and reduce risk.
08:37[00:02] we'll take a deep dive into one of the key tools in the smart Money Breakerblock concept, detailing every nuance. Despite the concept's immense popularity, there is objectively insufficient
[00:14] information on this topic in the public domain. Everything is superficial and does not answer even basic questions. Therefore, now you will learn what a breaker is and the logic behind its operation, how it is formed and determined, and how to trade it. The four best entries and choosing
[00:28] between an aggressive and conservative stop-loss, how to identify key intermediate targets for take-profits, and a checklist for an A+ breaker-based setup. When this video gets 2,000 likes, I'll
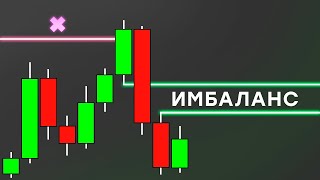
[00:43] break down the mitigation block in the same format. The key difference between a breaker and an upper block, block, or imbalance is that it is formed at the moment of a trend change and formation that changes the direction of the market. We can trade it at the
[01:00] initial stage of changing the upward trend to a downward one and vice versa. The formation of a custom breaker begins when the price reaches a significant institutional support zone on a higher timeframe.
[01:13] The formation necessarily includes three structural elements: LOW, Loverха and one more ll - these are five-candle swings. At the extreme low, a
[01:25] bearish order block should be formed, the impulse breakout of which will turn it into a bullish The price is expected to return to its test, get a reaction and continue to rise. The breaker range is our support zone, from
[01:38] which it is advisable to consider a long position. Now, in order. Why does this work and what is behind it? In essence, this is a classic bear trap, which perfectly illustrates the work of smart capital. The main event is
[01:53] the withdrawal. Smart money has two key objectives here: to fill its buy orders and to create a pool of liquidity on the other side for future asset markup. To achieve these goals, they artificially create a breakout, which
[02:08] provokes poorly informed traders to sell. And at the same time, stop-losses, previously set behind the local low, are also activated. A huge number of sell orders are entering the market , allowing
[02:21] smart capital to fill the required volume of its buy orders. As a result, a logical revaluation of the asset occurs in an upward direction, with a renewal of the structural lower-hay, which for adherents of traditional technical
[02:34] analysis automatically becomes a significant support level. Traders who entered short positions on the breakout are at a loss and will seek to minimize risks during the test of the previous high. And
[02:48] closing short positions is an order to buy, which will become a catalyst for further growth. In fact, smart money uses this to ensure the growth of the asset it needs for free, making a profit from it. But if you
[03:01] talk about being used in real time, subscribe to my Telegram channel using the link in the description. There is also a public chat where you can communicate with other traders. Now, a few basic nuances that determine
[03:15] how correctly and effectively you can use the tool. First, you need to make sure that the price has consolidated above the broken lower half, because this is a confirmation of the smart money's intentions for a
[03:27] future revaluation of the asset. And we, as smartmoney traders, will strive to follow them when opening our positions. If a simple sweep occurs and the candle body closes below the high, then the formation of a breaker is excluded, and
[03:41] we can no longer look for positions based on it . In our case, the body of the candle is fixed behind the swing, so we determine the upper point of the breaker range by the extremum of the broken swing. This is the point where uninformed
[03:54] traders will seek to close their losing short positions to minimize risks. The bottom point is the minimum of the bearish order block. We define it only in order to place an aggressive stop-loss behind it. If we want to
[04:07] trade more conservatively, we will place a stop loss behind the last swing from which the growth began. Then the lower boundary of the breaker will not have any practical significance to determine it. In many cases,
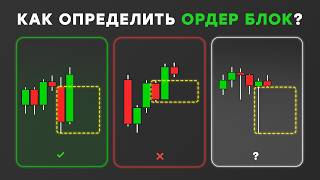
[04:19] one line will be enough for you to trade breakers. This is a rationalization of the analysis that you will come to over time. In the meantime, look at the highlighted ranges and select the correct options.
[04:31] We already know the first option is correct. The second one differs in that the swing extreme was formed by a falling candle, and it is not highlighted, which is a mistake, since the logic of the breaker’s operation is not taken into account . But the third option
[04:45] takes this into account, and we can trade based on the designated range. Well, the fourth option ignores the shadows of the candles. It does not comply with the basic principles of the tool, both in terms of starting a position search
[04:58] and setting a stop-loss, which makes it ineffective and useless effectively trade a breaker, you must understand how to enter a trade from it and set a stop-loss. The basic and simplest way is to place a
[05:12] limit order at its beginning. In this case, stop loss can be either aggressive or conservative depending on the situation. For example, I use an aggressive stop-loss only if the range minimum coincides with the minimum of the
[05:25] impulse candle that has broken through the structural top. Otherwise, I'll always go for the conservative lox soup. This is due to newly formed bullish inefficiency, which is a marker of active smart money buying and
[05:38] their focus on further delivering the price even higher while protecting the current range. Thus, the lower boundary of the breaker is validated for placing a stop loss behind it. bullish imbalance, which can be balanced on the very
[05:52] next candle, after which the growth will continue and a return to the breaker will not be expected. This will be the second more accurate move from the breaker. The full fill level, not yet confirmed imbalance, is used to open
[06:05] a long position, allowing for the best risk/reward ratio within a bullish setup even with a conservative stop loss. But this does not always happen. And it happens that the inefficiency is not completely filled, but a
[06:19] gap remains, to which the price will naturally gravitate, so the entry into the transaction will be made from its beginning. For me, this is the most optimal method for entering a trade. The breaker is a landmark, a key
[06:31] support zone, and the imbalance within it is a secondary zone that is used for better entry, both in terms of price action and timing. The next photo is a modification of the previous one and consists of using the
[06:45] volume profile on the range of inefficiency that has arisen inside the breaker. The level where the least volume was traded is highly likely to become the trigger for the price. We can place a limit order on it.
[06:59] These are the four key moves in a trade when trading a breaker. They are simple, reliable and effective. In reality, the analysis will not be limited to just one time frame. We will use at least two. For example, in our case, the weekly time frame
[07:14] is used as a guide. It defines the support zone from which the reversal occurs, and the resistance zone, which is a magnet for the price and, accordingly, the target for the future revaluation of the asset. We are expecting growth from
[07:28] one zone to another, but to open a trade, we need to see confirmation of a reversal in the form of a bullish breaker on the daily timeframe. With the removal of the first structural, Puvik was tested, followed by aggressive growth, during
[07:43] which Lower High was broken. Closing the candle body above it confirms the breaker, so already at this stage, following the plan from the weekly timeframe, long positions can be considered. Now we have the variability
[07:56] of placing a limit order in the form of the start of a breaker and the fulfillment level of the newly formed inefficiency. I choose the second entrance because it provides better and more flexibility. The logic is simple. If it is not activated on the
[08:10] next candle, a three-candle imbalance formation will form. In this case, we simply move the limit order to its beginning or, for greater accuracy, use the volume profile to open from the level with the lowest
[08:23] value. The stop-loss breaker will be acceptable because the minimum of the breaking candle is located at its lower border. However, given our rather ambitious goals, it would be more rational to set a conservative stop-loss beyond the last
[08:37] minimum, thereby improving the likelihood of our trade being successful. Setting one take profit is not the best strategy for managing a trade, because your scenario may only work partially, for example, 90%. After
[08:52] which a reversal will occur. In this case, you will not earn anything, you will only incur the initially estimated loss. Depending on the situation, I break profit-taking into three to four take-profits, identifying intermediate
[09:05] problem areas and liquidity pools. The fixing volume can be distributed differently, and it depends on the deal and the context in which you are trading. In our case, I would fix it according to the scheme 30, 20 and 50 or 25.50. It
[09:21] doesn't matter. When the first take profit is activated, the trade becomes risk-free, even without moving the stop loss. If we move it to used, then this already guarantees profit. The final price will, of course, be slightly lower than the initial one, and this is a
[09:35] reasonable price for increased control over your transactions. Now the bear breaker. It is completely analogous to the bullish one and works in a mirror image. Its development begins with the formation of structural, l and one more.
[09:50] The growth reaches a logical reversal point in the form of a significant resistance zone, from which the asset begins to decline, as a result of which it is broken through. Closing the candle body below the swing is the key aspect that validates a bearish
[10:04] breaker. From this point on, it becomes a full-fledged resistance zone, from which we can consider short positions. The price is expected to try to test the breaker and subsequently experience a strong reaction,
[10:17] after which the decline will continue. This is due to the influx of sell orders into the market. Uninformed traders who previously opened long positions will seek to cut losses by closing them.
[10:31] seek to cut losses by closing them. entry can be considered from the beginning of the bearish breaker and at the full fill level. If the imbalance is confirmed, then the entry will occur from its
[10:44] beginning. Well, the fourth option involves superimposing a volume profile on the least traded volume will be used to place a limit order. An aggressive stop loss is only relevant if the maximum of the
[10:58] breaking candle coincides with the upper boundary of the breaker. In all other situations, only a conservative stop beyond the last swing high is considered. In this example, on the hourly timeframe, we see a resistance zone in
[11:12] the form of an upper block. This is the range from which a reversal may occur. And below there is a clear imbalance, which acts as a magnet for the price and the primary target for a potential fall. Switching to the fifteen-minute
[11:24] time frame allows us to identify bearish breakers. The limit order is set to the fulfillment level. Stoop-loss is conservative for the last maximum and take-profit is at the beginning of the bullish imbalance from the hourly timeframe.
[11:37] We will also add two intermediate goals at local problem levels, from which a reaction may follow. The limit order was filled and, given that there was no inefficiency left in the breaker's range , the decline immediately
[11:49] continued. So, to trade a bearish breaker, it is necessary to determine the resistance zone from which a reversal will form , and then the target of the future fall. This is done on higher timeframes.
[12:03] The lower time frame is used to identify a reversal formation, often resembling the letter M and consisting of structural PXs. and one more. A momentum-falling candle that breaks through should consolidate below
[12:19] it, leaving bearish ineffectiveness. This simple combination of factors will allow you to place a limit order to open a high-quality and highly effective short position. With a bullish breaker it's the same, only the other way around.
[12:32] Everything is on the screen, I won’t repeat myself. When this video gets 2,000 likes, I'll also go into more detail about the mitigation block. Good luck.
⚡ Saved you 0h 12m reading this? Transcribe any YouTube video for free — no signup needed.