
What is an Order Block?
60sDefines a core Smart Money concept with clear bullish/bearish examples, appealing to traders seeking foundational knowledge.
▶ Play Clip"Title promises a complete guide from scratch, and the video delivers a thorough tutorial on order blocks."
This video provides a comprehensive guide to understanding and trading Order Blocks in the Smart Money Concept. It covers the basics of formation, common mistakes, advanced entry techniques, and key criteria for identifying high-probability setups.
A manipulative tool denoting accumulation of positions by smart capital. Bullish order block shows purchases and acts as support; bearish shows sales and acts as resistance.
Two key criteria: withdrawal of liquidity and absorption. Formation consists of two candles, each with its own function.
Range of the first falling candle from open to minimum including lower shadow. If engulfing candle forms new extreme, boundary shifts to lowest point of second candle.
Smart money needs liquidity to fill large orders. They create liquidity by manipulating price to trigger stop-losses, then buy at favorable prices.
First candle is manipulative, second must engulf it to confirm order block. Look for imbalances on lower timeframes during absorption.
Smart money returns price to close losing short positions, providing best buying opportunity. Requires significant sell liquidity before or within the block.
A closed candle with a shadow that removes liquidity: the range from open to extreme is the order block in 100% of cases.
Best order blocks originate from other order blocks or areas of interest, are accompanied by imbalance, show structure breakout, and have liquidity for sale.
Weak blocks often have unfilled imbalances on higher timeframes acting as price magnets. Context from higher timeframes is crucial.
Basic: beginning of order block and 50% level. Advanced: imbalance on lower timeframes, reversal patterns like 3D, W, M.
Mastering order blocks requires understanding their formation, context, and entry techniques. Practice with the provided cheat sheet and focus on higher timeframes for better accuracy.
What is an order block?
A manipulative tool denoting accumulation of positions by smart capital.
00:45
What are the two key criteria for order block formation?
Withdrawal of liquidity and absorption.
02:06
How do you determine the boundary of a bullish order block?
Range of the first falling candle from open to minimum including lower shadow.
02:22
Why does smart money create liquidity?
To fill large orders without inflating the average purchase price.
04:48
What confirms an order block?
The next candle must engulf the manipulative candle.
06:52
What is the simplified method to identify an order block?
A closed candle with a shadow that removes liquidity; the range from open to extreme is the order block.
11:14
What are the four additional criteria for a strong order block?
Originates from other order blocks, accompanied by imbalance, structure breakout, and liquidity for sale.
13:52
What causes a weak order block?
An unfilled imbalance on a higher timeframe acting as a price magnet.
16:23
What are the basic entry points from an order block?
The beginning of the order block and its 50% level.
17:33
What advanced entry technique uses reversal patterns?
Entering on 3D, W, or M patterns after order block test.
19:40
Definition of Order Block
Core concept of the video; establishes foundation for all subsequent techniques.
00:45Logic Behind Order Block
Explains the rationale of smart money manipulation, crucial for understanding market mechanics.
04:33Simplified Method
Provides a foolproof technique for identifying order blocks, increasing accuracy.
11:14Improving Accuracy
Lists additional criteria that significantly enhance win rate.
13:52Entry Points
Practical guidance on where to enter trades, directly applicable to trading.
17:33[00:02] we'll explore one of the most popular, yet least explored, tools in the SmartMoney Orderbook concept. Many have heard about it, many try to use it, but only a few do it truly correctly and
[00:16] effectively. We will start from scratch and gradually move on to more advanced techniques. The main part of the information is a unique and time-tested method that has no analogue on the Internet. If anything,
[00:31] has no analogue on the Internet. If anything, you will also find daily market analytics, where you can see how everything I talk about works in real time. Link in the description. So, what is a block
[00:45] ? It is a manipulative tool that denotes the accumulation of positions by smart capital. The bullish urderblock shows their purchases and acts as a powerful support zone, testing which could lead to the
[00:58] testing which could lead to the beginning of aggressive growth. Its complete opposite is a bearish order block. It reflects sales by major market participants and serves as a strong resistance zone from which the price
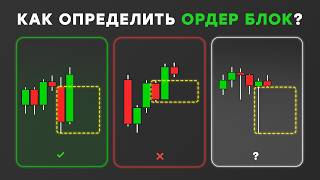
[01:11] reacts and begins to decline actively. Before we dive into the topic, let's look at examples of the most common and serious mistakes newbies make when using URLBlock. If you're already familiar with this
[01:24] concept, try doing a quick exercise, pause, and find examples with real order blocks. Also notice how they stand out. Identify them correctly. If this is your first time hearing about Order Block
[01:38] , don't worry, just keep listening and everything will become clear. Among all the schemes shown, there are only two order books. And here's how they are defined. If you have successfully completed the task, then this is already an excellent
[01:51] result. Now that you have a basic understanding of order blocking, we'll move on to more advanced aspects of its use. And if the task turned out to be difficult, it’s okay . That's what this lesson is for. Let's start from scratch and be sure to return
[02:06] to these examples. First, let's look at the basics of how a block is formed. To determine it, two key criteria must be taken into account . The first is the withdrawal of liquidity. The second is absorption. As a result, we get
[02:22] a formation of two candles, each of which performs its own function. Now how to correctly determine the boundaries of the order block? In everyday life, this is the range of the first falling candle from the open to its minimum, including the lower
[02:38] shadow. If the decline extreme is formed by an engulfing candle, the boundary of the upper block shifts to the lowest point of the second candle. This is a nuance that not everyone knows. Why is this important? Because
[02:52] the order block is a support zone on the basis of which trades are opened. If you don't accurately determine its beginning, you may miss the entry point or enter too early. In the first example, the hourly order block was valid for entry until the
[03:05] four-hour block was confirmed. After this, you only need to focus on it. Remember, higher timeframes are always more important than lower ones. The second situation clearly of the URL block. Because of this, the entry occurs too early, and the risk/
[03:22] reward ratio is worse compared to entering from the open of a falling candle. This is exactly how it was necessary to work with the Urderblock. Remember, the upper shadow can be taken into account if a bullish imbalance has formed and confirmed on the engulfing candle .
[03:37] In the third and final example, the lower boundary of is placed at a point where the trade is still valid. This is an error that directly affects your winrpeate. Remember, the bull block always forms a
[03:52] clear depression from which active growth begins. If it is updated, the block loses its relevance. Now, these may seem like Now, these may seem like small things to you, but I assure you, these are extremely
[04:05] serious things that, in the long run, will have a key impact on whether you become a profitable trader or not. Little things make a difference. In the case of a bearish Order Block, we follow the same rules. Its
[04:19] range is built on the first manipulative candle from the open to the high, including the upper shadow. If the second candle forms a new growth extreme, the upper block boundary shifts to the maximum point of the second candle.
[04:33] opening a short position. Why does the block work? Let's analyze his logic. Let's imagine that we have a fund that wants to buy 10,000 bitcoins. If he just clicks buy at market
[04:48] price, what will happen? It will immediately trigger aggressive growth, because at the current rate there will be no sellers willing to give up 10,000 bitcoins. Therefore, the price will rise until demand is
[05:02] fully satisfied. What's the problem? This approach greatly inflates the average purchase price. Instead of entering at the conditional 100,000, the average opening price will be 120,000, which makes this scenario unprofitable, and therefore
[05:17] uninteresting for smart capital. To avoid such situations, our fund will look for areas with a huge concentration of liquidity. There should be enough sellers in such places to cover the demand of 10,000 bitcoins. If such
[05:31] liquidity zones do not exist, then smart money creates them on its own. They keep the price within a narrow range and create conditions under which poorly informed traders enter the market. Typically, this is done with the help of
[05:45] news, traditional support and resistance levels, patterns, trend lines, indicator signals, and, in general, anything that inspires confidence in the majority. As a result, a large pull of liquidity for sale was formed
[05:58] consists of stop-losses of traders who opened long positions. And these, as you understand, are sell orders capable of covering our demand of 10,000 bitcoins.
[06:10] When the price drops below our artificially created level, smart money will start actively buying at a favorable price and with little noticeable influence on the market. This was their original goal: to implement conditions
[06:24] that would subsequently allow them to earn money on the revaluation of the asset in an upward direction. Now let's figure out why I call the first case manipulative. Because it is at this moment that smart
[06:37] capital, using its own hardware for sale, initiates a downward price movement along the same pre-arranged pull liquidity. They sell to buy. By the way, they partially provide liquidity to themselves,
[06:52] but in relatively small volumes. The bulk still comes from outside. The next candle must definitely engulf the manipulative one. This is the order block confirmation. This price behavior indicates aggressive
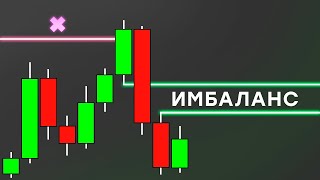
[07:06] buying by smart capital and their interest in further growth of the asset. During absorption, look for imbalances on lower timeframes. This is an early confirmation of the start of an upward order flow, as well as a trigger from which the price is
[07:20] highly likely to react. Take a look at the simplest trade entry setup, consisting of just three elements: manipulation, absorption, and imbalance on a lower timeframe. Its beginning is your entrance.
[07:34] Stuplos is placed behind the word block, and yk profit is on the left side of the graph. This is the nearest semi-liquidity and the first problem area behind it. If you don't yet know how to set target levels, you can use a
[07:47] one-to-two risk-to-reward ratio as a guideline and expect a win rate of around 40%. Here is a table of timeframes that can be used when searching for imbalances within an order block. For example, if you find an order block on the hourly timeframe, then
[08:01] an order block on the hourly timeframe, then look at the imbalance within it on the 15 and 5 minutes for a more accurate entry. Now let's figure out why the price retests the Order Block. Smart money is returning prices to the upper limit to
[08:15] close out their losing short positions that were opened during the short-term valuation of the asset under significant semi-liquidity for sale. For us, this event is the best moment for buying, because the smart money is
[08:28] essentially completing its manipulation and starting to aggressively push the price up to secure a profit on the previously accumulated moon positions. But it's not that simple. There is one nuance to all of this, without which
[08:41] the order block will not work by definition. There must be significant semi-liquidity for sale before or within it, because the closing of unprofitable short positions is a buy order, which means that smart
[08:56] money will prepare the ground in advance to satisfy its demand. For example, let's say they sold a total of 1,000 bitcoins. First, while the price is held in a narrow range while forming liquidity for sale,
[09:10] and then during the manipulation itself below its lower limit. Consequently, they have a demand for at least these thousands of bitcoins, which they must necessarily cover. This is done by engineering sell liquidity pools
[09:24] ahead of the order block. If you notice this on the chart, you know that you have a strong signal in front of you to consider a moon position. If there is no liquidity pool in front of the Urderblok and it is tested almost immediately,
[09:38] consolidation often begins within it. At this point, a series of downward manipulations should appear. This is a key signal that smart money is actively filling its buy orders. To find the optimal entry point, you can
[09:51] rely on the accumulation schemes of the first and second types of wicks. In both cases the essence is the same. Smart money closes unprofitable short positions and then launches an aggressive markup of the asset. If you don't see any of
[10:06] these signs, you shouldn't enter such an order block. It is highly likely that it will not put pressure on the price and will be easily broken. Now let's look at a simplified method for determining a
[10:18] URL block. But first, try to figure out for yourself which of the examples shown display URL blocks of the information you have already received. And just a little bit of cognitive ability will be more than enough to solve this
[10:33] problem without any problems. As you probably already understand, there are both bullish and bearish upper blocks here, as well as things that just look like them. Let's start with the top row. The first diagram shows a standard order block,
[10:47] which we have already discussed. On the second one it’s the same, but on a higher timeframe. For example, the first one is at one o'clock, the second one is at four o'clock. But the third example does not correspond to the characteristics of the order block, because
[11:00] the price did not absorb the manipulative movement. This is a key factor that confirms our formation. Basically, the second scheme is a basic template that will allow you to accurately find order blocks in any
[11:14] market situation. You only need one thing: a closed growing candle, a lower shadow that removes liquidity for sale. The range from its opening to the extreme The range from its opening to the extreme fall is the Urderbook in 100% of
[11:29] cases. It will act as both a support zone and a price magnet. Let wish, you can always find classic two-candlestick urder blocks. But doing this is not necessary, and in some cases it does not make
[11:43] sense at all, because it may require non-standard timeframes, as in this example. Remember, if you find an Urblock in the form of a candle shadow on one of the standard timeframes shown on the screen,
[11:56] then you have already identified it correctly and without error. Now look at the bearish examples. Their mechanics are completely identical to those of bullish Urderblocks. The difference is only in the direction of movement. They work in mirror image.
[12:12] Therefore, both the first and second schemes meet the Urderblok criteria. Their pricing is the same. The only difference is the timeframe on which they are displayed. In the first case, this is, for example, a weekly timeframe, in the second, a
[12:27] monthly one. As you most likely know, any analysis is always carried out from top to any analysis is always carried out from top to bottom, from higher timeframes to lower ones. This is related to the hierarchy of importance. The higher the time frame, the stronger its influence. That
[12:40] 's why the order block for the second scheme is your main guideline, which you is your main guideline, which you should always rely on. Remember, the candle must be falling and already closed, and its upper shadow must remove
[12:53] liquidity for buying. This entire range will be a guaranteed block. The third example is not an Urderblock because it did not involve the absorption of the impulse rus. Always pay attention to this. In general, it
[13:08] principles of the formation and operation of the Urderblock so that you will never again make mistakes when defining it and marking it on the chart. So, let's sum it up . The shadow range, in both bullish and bearish
[13:23] versions, allows you to accurately determine the actual order block. This is a simplified technique that you can use on an ongoing basis. There is no way to make a mistake here. It works and will work. As for entry,
[13:37] focus on the beginning and middle of the order block range. These are the levels from which the price most often reacts. We will look at this in more detail a little later. How to improve the accuracy and efficiency of Urderblock? The
[13:52] easiest way is to take more criteria into account when forming it. First. The best order blocks are not formed by chance. They originate from other order blocks or areas of interest, such as an imbalance, block, or
[14:06] breaker. This gives you a good reason to believe that the decline is indeed over. But, for example, if equal minimums and an unfilled imbalance remain under the orderbook, the chances of it being worked out will be
[14:19] extremely low. Second. Strong order blocks are always accompanied by imbalance. It is formed on an engulfing candle and serves as additional confirmation of the active actions of smart money. Third. Breakdown of the
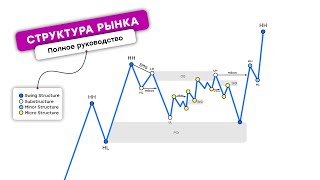
[14:32] structure. A five-candle swing breakout should occur. Working with liquidity to buy and forming a new trading range clearly shows the intention of large capital to continue to mark up the asset. Well, and
[14:46] fourthly, this is liquidity for sale. We have already discussed this in detail. It is this that allows smart money to close its unprofitable short positions. Before the start of aggressive growth. For a bearish order block, everything
[14:58] works in reverse. We take into account the resistance zone test , the presence of imbalance, the breakdown structure and liquidity for buying. These are basic yet highly that will help you increase your win rate when
[15:13] working with Urderblocks. Of course, the list of factors can expand as your experience grows. As the fifth and sixth points, you can add fifth and sixth points, you can add hidden divergence for RSI and SMT
[15:25] divergence. These are objectively powerful, but rather complex tools that, in my opinion , only get in the way and confuse you at the initial stage . So start with dreams. And when you feel that you are ready and there is a real
[15:40] need for it, connect new tools. The more factors you take into account, the higher the chance that the order block will work exactly as you expect. How to identify a weak order block? The chart shows an order block that
[15:55] meets all mandatory and additional formation criteria. However, when testing it, the price does not show any significant reaction and simply breaks through the zone. Some might say that this is not an error in analysis, but a
[16:09] natural part of any strategy. And such situations are the inevitable price for working with probabilities. In some truly rare cases, this can indeed be agreed with. But in most situations the cause still
[16:23] lies in analysis errors. If you look at what is under our order block on higher timeframes, you can see an unfilled imbalance. It acted as a key price magnet and after its rebalancing, the
[16:36] rise continued. Imagine how many order blocks on different timeframes were broken while the price was moving towards our inefficiency. They are all entry points that are doomed to fail. The fact is
[16:49] that mandatory and additional criteria alone are not enough to trade stably and effectively. Context plays a decisive role. It's impossible to cover everything in detail in one video, but I'll outline the main point. Higher
[17:05] timeframes are always more important than lower ones. If you find an ideal order block on the daily timeframe, but there is another order block or an unfilled imbalance below it on the monthly timeframe, the price will primarily go there, and the daily
[17:18] order block will be broken. Here is the hierarchy of standard timeframes. The higher, the more significant. Any contradictions are resolved strictly according to seniority. Now let's look at the best entry points from Urderblock. I divide them into
[17:33] entry points from Urderblock. I divide them into basic and advanced. Let's start with the basics. This is the level of the beginning of the Urderblock and its 50%. The best order blocks receive a reaction from the first level, which is why a limit order is most often placed on it
[17:47] , and a stop-loss is always placed below its minimum. The second level works on the same principle, but is not always tested, and this is its main drawback. Because of this, you may miss some good entry points. At the same time, it
[18:02] has a significant advantage in the form of a better risk-reward ratio. The difference is noticeable, and depending on the situation it can become even greater. These are two simple approaches you can start using
[18:16] today. I'll immediately point out one of the techniques that I often use when assessing basic trigger levels. This is an analysis of the strength or weakness of an asset through intra-market correlation. In short, if an asset shows strength,
[18:30] I am only interested in the first level. That's where I place my long limit order . The likelihood of a deeper fall in this case is minimal. If the asset shows weakness, I only focus on the 50% level. Its
[18:44] testing is typical for lagging assets. Now let's look at advanced entry points. They require more experience, insight, and discipline, but in return they provide greater accuracy, a deeper understanding of what is happening in the market, and more flexibility
[19:00] in decision-making. The first is something we have already discussed. There is an imbalance within the best level blocks on lower timeframes , and this is what acts as a trigger for the price. A limit order is placed at the beginning of the imbalance.
[19:14] Stop-loss can be set in different ways: conservatively under the extreme of the mind block, aggressively under the first candle of imbalance. Use an aggressive approach only when
[19:26] you clearly understand what you are doing. In addition to imbalance, triggers can also be other areas of interest on lower timeframes: Order Block, Breaker, or Mitication Block. The second technique, truly advanced and in skilled hands, shows
[19:40] excellent results. It allows you to find the most appropriate and, most importantly, timely entry points with the best risk-reward ratio. But not everyone can implement it. Lack of experience, impatience and
[19:54] insufficient attention to detail are obstacles. Judging by the examples, it is already clear that we are talking about entering a trade based on reversal formations that form on lower timeframes when testing the level block. In the first case, entry occurs at the
[20:08] last stage of the formation of the 3D Pattern reversal structure. This is an aggressive option because there is no confirmation of a reversal yet. In the second case, the deal is opened immediately after the structure is broken. This confirms the reversal
[20:22] information and indicates that smart money is actively moving to further increase the asset. And the third scenario is the most conservative. We enter the trade only after a correction to the first zone of interest, already on a successfully
[20:36] zone of interest, already on a successfully confirmed formation. In addition to the three- pattern, you can use the reversal formation W for a bullish scenario and M for a bearish one. These are key patterns of price change and entries based on them
[20:51] are found at almost every reversal. Here is a universal timeframe grid that will help you find reversal patterns when testing order blocks. and other areas of interest. For example, if an Urblock
[21:05] reversal setups should be looked for on the hourly and fifteen-minute timeframes. As you may have already seen, today's lesson is a manual base on order blocking. A file containing a summary of key points, diagrams, and
[21:19] examples is now available in my Telegram channel. Be sure to save it for yourself as a cheat sheet. This is just a small part of what I can share. But this is precisely the part where you should start your journey. Simple, clear and from scratch.
[21:34] start your journey. Simple, clear and from scratch. Good luck in your studies and practice.
⚡ Saved you 0h 21m reading this? Transcribe any YouTube video for free — no signup needed.