Why Smart Money Returns to Order Blocks
54sReveals the hidden logic behind price retracements, offering a unique insider perspective that piques curiosity.
▶ Play Clip"Delivers a thorough breakdown of order blocks, but the title oversells 'everything you need to know' with some repetitive filler."
This video provides a comprehensive analysis of order blocks in trading, explaining the logic behind smart money, how order blocks are formed, and how to identify and use them effectively. The presenter emphasizes a rethought and modified theory that is more practical than commonly available information, covering both bearish and bullish order blocks with detailed examples and nuances.
The video will analyze order blocks in detail, explaining the logic behind smart money, how they are formed, and how to use them. The presenter claims this is a rethought and modified theory that is effective and easy to use, unlike vague public information.
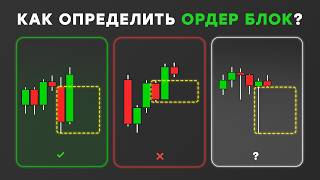
An order block is a candle that shows purchases or sales of smart capital. A bullish order block indicates accumulation for further appreciation, while a bearish order block indicates distribution for further depreciation. After large volume trades, traces remain on the chart that can be used for entries.
A bearish order block is the last rising candle that removes liquidity for purchases and is then absorbed, confirming the block. At this point, one can consider opening a short position without waiting for a test. Stop loss is placed above the shadow of the last rising candle.
Besides liquidity removal and absorption, other factors increase efficiency: price should reach a problem area after updating liquidity, and a sharp fall should break the bullish structure to form a bearish balance. Combining these factors increases probability.
To determine boundaries, consider candle shadows on both sides. The highlighted candle is the zone of interest. Standard trigger points are the beginning and 50% of the block. Best order blocks react from the minimum (confirmation point). To find 50%, stretch Fibonacci from the minimum of the green candle body to its extreme, including the shadow.
Stop loss is always placed above the order block. After a reaction, it can be moved slightly above the 50% level to reduce risk. Initial targets are the minimum from which the correction began, and then the bearish balance below.
If after absorption there is no bearish balance (the next falling candle reaches the minimum and continues), the lower shadow is not considered; the range is from the body of the green candle to its extremum.
If the shadow of the engulfing candle is higher than the shadow of the green candle, the upper border of the bearish order block is the shadow of the engulfing candle, and stop loss is placed behind it. For 50%, stretch Fibonacci from the beginning of the green candle body to the extremum of the swing.
Smart money returns price to a fixed order block to fix unprofitable long positions at breakeven before further depreciation. Long positions were opened from the low to activate stop-losses above, filling required volume for accumulation. This is accompanied by removal of local liquidity for buys or manipulation of highs.
Not all opposite colored candles before an impulse are order blocks. This is a common misconception due to lack of public information. Incorrect use results from misunderstanding. Bullish order blocks follow the same logic as bearish, just reversed.
A bullish order block is the last falling candle that removes liquidity for sale and is absorbed, confirming it. Only blocks formed from support are valid. Confirmation is the breakdown of bearish structure and formation of bullish balance.
Combine factors: smart capital marked down asset to update old low, behind which stop-losses for sales are located. This liquidity forms long position volume. Unprofitable short positions are closed before markup, causing price return to the order block.
Primary target is the nearest maximum from which correction began. Second target is the bearish balance above it.
Order block is your zone of interest. Main criteria for formation are liquidity removal and absorption. Additional criteria: test of support zone, bearish structure, and balance formation. Fewer factors considered leads to lower win rate. Always consider higher timeframe direction.
The presenter analyzes a bearish order block on Bitcoin, emphasizing that determining general price direction is more important than all other factors. Bullish order blocks formed on growth will be broken because higher timeframes are bearish, expecting lows at 28k.
Pricing often turns out to be symmetrical, with both bullish and bearish order blocks forming in a narrow range. Without bias from higher timeframes, you cannot effectively use this tool.
In the weekly range, price updated upper boundary and partially filled monthly imbalance. A green full-bodied candle can be considered a bearish order block, already tested. After rejection, expect a deviation to update the low. Similar range on monthly timeframe with target at 28k.
Bullish order blocks formed during growth will be broken, but we can expect a slowdown in the fall when price tests them, possibly causing a correction or consolidation.
A bearish order block determined by the shadow of candles removing liquidity from the previous week's high. On lower timeframes, there will be two full-bodied candles forming a classic bearish order block.
On the two-day timeframe, instead of a shadow, we see an absorbed green candle that removed liquidity for buying. A bearish balance was not formed, but mandatory factors are still present, so the order block is valid.
In this case, four criteria are met: test of resistance zone, removal of liquidity for buying, absorption, and higher timeframe bearish bias.
Marked candle shadows are bearish order blocks. To find classic display, go to lower timeframes where full-bodied candles remove liquidity and are absorbed.
A full-bodied green candle updates the current day's high and is absorbed. No bearish balance formed, but the order block is still valid. Price tends to fill the balance inside the block, then reacts after updating the low.
Inside the order block, price often consolidates because smart capital closes unprofitable long positions, requiring liquidity for purchases. However, consolidation may not happen if liquidity pools are under the block.
The shadow of the engulfing candle is higher than the shadow of the green candle. The order block is formed on extremes, so the upper boundary is the engulfing shadow. Placing stop loss above the green candle can lead to being knocked out.
The difference between the high of the green and black candles can be significant. Placing stop loss above the green candle can lead to losses. Understanding candle formation is crucial.
On the two-hour timeframe, there is a classic display with absorption. Defining the order block this way helps set correct stop loss. The price formation between order blocks is the same; only the timeframe differs.
On the 90-minute timeframe, a full-bodied growing candle removes liquidity from the previous day's high and is absorbed. This clarifies stop loss placement. The trigger point was the previous order block on the hourly timeframe, inside the two-day order block.
Initial target is the minimum from which correction began. Next target is the first problem zone below, a bullish imbalance. For the 90-minute block, set a retake at the low where correction began.
After updating the low, the internal ascending structure broke, leading to a rapid buyback where local liquidity was updated and manipulation of highs occurred, followed by an aggressive decline.
When all criteria are met and working with higher timeframes, there is a high probability of success. Bullish order blocks were formed but not interesting due to bearish bias.
A recent bearish order block formed after withdrawal of liquidity for purchase from the previous month. On September 12, the block was tested, and price aggressively declined. The presenter shares expectations on Telegram.
A bullish order block formed when the daily bullish imbalance was partially filled. The black full-bodied candle removes liquidity of the previous week's low and is absorbed, breaking the bearish structure. All criteria are met except one (no balance), but that's not a factor.
When the balance inside the order block is filled on a lower timeframe, an aggressive upward movement begins. The price received a reaction from 50% of a previously tested order block.
A bullish order block formed during a test of another daily order block. After consolidation and removal of short-term liquidity, price reacted and ascending pricing began. A falling candle is another former order block, with classic display on lower timeframe.
Order blocks are easy to find and apply. Formation criteria are simple, but nuances must be considered. Practice on historical data to understand boundaries. Always consider higher timeframe direction for effectiveness.
Order blocks are powerful tools when correctly identified and used in alignment with higher timeframe direction. The key is to combine all formation criteria and maintain a clear bias from higher timeframes to achieve high probability trades.
What is an order block?
A candle that shows purchases or sales of smart capital.
01:13
What is the last rising candle that removes liquidity for purchases and is absorbed?
A bearish order block.
02:15
What are the two standard trigger points for an order block?
Its beginning and 50 percent.
03:59
How do you determine the 50% level of an order block?
Stretch Fibonacci from the minimum of the green candle body to its extreme, including the shadow.
04:43
Where is the stop loss placed for a bearish order block?
Above the shadow of the last rising candle.
02:31
What happens if the shadow of the engulfing candle is higher than the shadow of the green candle?
The upper border of the bearish order block is the shadow of the engulfing candle, and stop loss is placed behind it.
06:41
Why does price return to an order block?
Smart money returns price to fix unprofitable long positions at breakeven before further depreciation.
07:11
What is the primary target when opening a long position from a bullish order block?
The nearest maximum from which the correction began.
11:32
What is the most important factor when trading order blocks?
The general price direction from higher timeframes.
12:14
What are the main criteria for order block formation?
Removing liquidity and absorption.
12:01
Definition of Order Block
Provides a clear, concise definition that is the foundation of the entire video.
01:13Bearish Order Block Formation
Explains the exact mechanics of how a bearish order block forms, which is crucial for identification.
02:15Fibonacci Method for 50% Level
Offers a specific, actionable method for determining the 50% trigger point, differing from classic methods.
04:43Why Price Returns to Order Block
Reveals the underlying smart money logic, which is often not explained in other resources.
07:11Higher Timeframe Bias
Emphasizes the critical importance of higher timeframe direction, a key factor for success.
12:14[00:02] in today's video we will analyze the order block in detail, I will explain the logic behind how smart money works, how and why it is formed and how it is used, I will show how to correctly
[00:14] identify it and what factors should be taken into account for its use. In this lesson, you will see the difference in comparison with other videos that you may have previously watched on this topic. This is a rethought and modified
[00:29] theory, it is effective in application and easy to use. The information that you may have seen in the public domain and in some paid training is to some extent not relevant simply because it does not provide an answer to the
[00:45] questions that arise, it is too vague and not effective enough to use. You will be able to see this after watching this lesson, but the order blog is used in a completely different way, unlike what
[00:59] most of you are used to seeing, this gives me a high variability of its use and a deep understanding of how the Tour de Block actually works. how the Tour de Block actually works. How and why it is formed.
[01:13] Before Tim's explanation of today's lesson, I recommend subscribing to my telegram channel. Here I write about trading analytics and thoughts on the market. You will find a lot of useful and interesting information in it. For information for yourself as a trader,
[01:27] follow the link in the description under the video. What is an order block? This is a candle that shows purchases or sales of smart capital. When a bullish order block is formed, a
[01:45] further asset appreciation. When a Bearish worder blook is formed, a Bearish worder blook is formed, a short position accumulates or reaccumulates with the aim of further asset appreciation. After trading a large volume,
[01:59] traces always remain on the chart that we can see and implement by opening a trade in the direction in which the asset will be appreciated or discounted. Here, the diagram shows a bearish order block. This is the last rising candle
[02:15] that removes liquidity for the purchase and is then absorbed, thus, by the bearish order block, it becomes confirmed. At this point, you can already consider opening a short position without waiting for it to be tested. This will be one of the
[02:31] entry options. A stop loss will be placed above the shadow of the last rising candle. Because if the price goes beyond this High, the order block will lose its relevance.
[02:43] In addition to removing liquidity and absorption, additional factors of its formation should also be taken into account. This will significantly increase The efficiency of using the order book We always want to see that the price after updating the liquidity for
[02:58] purchase reaches the problem area, from where it can get a reaction and form a reversal. We always take this criterion into account because it is important for me to offend the reason why the price reaction will occur in this range
[03:13] and the Turk. In this case, it will be relevant to use an aggressive option for entry immediately on the absorption of a growing candle. We also want to see that after removing the liquidity for purchase, a sharp
[03:28] fall begins, on which the Butch structure will be broken and a bearish balance will be formed. This will confirm that smart capital will actually evaluate the asset. Try to combine the listed
[03:43] factors. If you want to see a high probability of working out when using an order block to determine the boundaries of the order book, you need to take into account the shadows of the candles on both sides. The highlighted candle is our zone of interest.
[03:59] Where will the start of the asset assessment be expected, where we expect a price reaction? There are two standard trigger points: its beginning and 50 percent. The
[04:11] best order blocks receive a reaction from its minimum, that is, where it was confirmed, it is from these values that the asset markdown begins in most cases. Of course, this does not always happen and in some cases, the price will
[04:26] return. in the 50 percent range, which is the second area. Where can we expect a price reaction in order to determine the 50 percent order block? We need to stretch the Fibonacci grid from the minimum of the green candle body
[04:43] to its extreme. Only on this side is the shadow already taken into account. This is how I determine half of the order block. But in the classic version, the grid
[04:55] is stretched only under the body of the green candle, ignoring its shadows. But this does not work as effectively as shown in another method. You will be able to see this when you conduct a backtest. Of course, there are ways by which you can
[05:11] most accurately determine the trigger point where the price will receive a reaction from the order block, but now I am not going to talk about this, since this will drag out the lesson too much. In addition, this information is not necessary for the
[05:27] tool. Regarding the stop loss, it will always be placed above the header block in the future. When the price has already received a reaction from it and began to move in a downward direction, on which
[05:43] other problem areas were formed, for an upward movement, we can move the stop loss slightly above the 50 percent order block. This is done to reduce the risk. The initial targets for the fall will be
[05:56] initial targets for the fall will be this minimum from which it began. Correction [ __ ] balance below it now we will analyze some nuances how the order book range will be considered if after absorption there is no
[06:11] immobile balance, that is, the next falling candle after absorption reaches the minimum of the order block and continues to fall. In such cases, we will not take into account the lower shadow of the candle and the range of the Order block will be
[06:26] considered only from the body of the green candle to its extremum. Where did the candle to its extremum. Where did the fall begin? Well, one more thing. What to do if the shadow of the engulfing candle is higher than the shadow of the green candle, how in such
[06:41] situations will it be correct to determine the Krinitsa order block of its 50 percent and where to place the stop loss is the shadow of the candle will be considered. The upper border of the bearish order block, the stop loss will also be placed behind it and not behind the High of the
[06:56] green candle. And to determine its 50 percent, we will stretch the Fibonacci grid from the beginning of the body of the green candle to the extremum of the swing. Where did the fall begin? These are the main nuances when working with a
[07:11] bearish order block. Why does the price return to the order block and why does it receive a reaction from it. How does it work? Smart money returns the price to A fixed order block in order to
[07:25] fix their unprofitable Long positions breakeven before further positions breakeven before further depreciation of the asset. Long positions were opened starting from this Low in order to activate a stop-loss on a buy position that was
[07:38] stop-loss on a buy position that was above this level. These stop-losses will allow filling the required volume for accumulation or reaction of a short position in order to further evaluate the asset. Now, in order to ensure a
[07:52] breakeven, when such a Long position is closed, the asset is revalued in the bearish order block area because it was in this candle that the largest volume was traded. Usually, this will be accompanied by the removal of local
[08:06] liquidity for a buy that was formed on this fall or manipulation of highs in the order block itself. After which an aggressive fall will begin. This is how the market works and the algorithms that deliver the price to a certain
[08:23] value. There are no accidents here and every movement has its own logic. Liquidity and inefficient pricing are always at the core. These are the true reasons why the price falls or rises,
[08:38] and based on what I just told you, why an order book is formed and how it is used by smart capital, you can make it simple. Conclusion: Not all the opposite colored fistulas before the impulse will be order blocks. This is a popular
[08:54] misconception due to the lack of publicly available information regarding some instruments. Because of this, you can find many variations of the names of the same instruments, as well as a peculiar explanation of the logic of their work that
[09:09] have nothing to do with reality. Well, this state of affairs results in the incorrect use of the studied instruments. Now, regarding the former order block, I will not devote too much time to this. In order not to
[09:24] drag out this lesson too much, simply because the logic of bullish instruments is always the same as bearish ones. Only the direction of the price changes. The the direction of the price changes. The block is the last falling candle
[09:38] that removes liquidity for sale and is absorbed at this moment. Its confirmation occurs. absorbed at this moment. Its confirmation occurs. only the second blocks that are formed from the support umbrella because this will be the
[09:54] reason. Why exactly from these values the asset will be marked up, and confirmation of this will be the breakdown of the bearish structure and the formation of a bullish balance on this growth. Additional formation criteria
[10:10] should be taken into account at least in order to understand which order blocks should be used and which should not. Therefore, if you want to use this tool most effectively Combine the listed factors
[10:26] in this range. Smart capital marked down the asset in order to update the old Low, behind which the stop loss for sale is located. With the help of this liquidity, the volume of a Long position will be formed or increased in
[10:40] order to further mark up the asset. Thus, starting from this High, an unprofitable short position was opened, the main volume of which was traded in the
[10:52] last candle removing liquidity for sale. They will try to close such an unprofitable short position before the asset markup. In order to ensure breakeven, when closing this transaction, we will see the price return to this former
[11:08] order block, where it will be better for us to open a Long position by placing a stop loss below this minimum. Usually, this will be accompanied by the removal of
[11:20] local liquidity for sale that was formed on this growth or manipulation of lows in the order block itself, after which an aggressive growth will begin. The
[11:32] primary target when opening a Long position will be the nearest maximum from which the correction began. And the second target where we can completely close our transaction will be the bearish balance above it. To
[11:46] balance above it. To summarize, the order block is your zone of interest. Where are you from? When considering opening a position, the main criteria for forming extreme positions are simply removing liquidity and absorption, and
[12:01] additional criteria will be a test of the support zone after removing liquidity for selling amounts, a bearish structure, and balance formation. The fewer factors
[12:14] you take into account, the less you will have. Pay attention to the general price direction; this is the most important factor. You should not wait for a bullish order block to be executed when the higher timeframes are bearish.
[12:29] Well, the same applies to a bearish order book; when the higher timeframes are bullish, of course, there may be a price reaction. It is quite likely that it will begin to consolidate or correct, but ultimately they will be broken. The main reason for this will always
[12:46] be an incorrect determination of the price direction on the daily, weekly, and monthly timeframes. Now let's look at several examples of a bearish order block in this range. Previous videos and also on the Telegram channel.
[13:00] I have already analyzed this pricing in detail and explained why I was biased towards the bearish, but I will still briefly repeat the main reasons for considering short positions. Determining the general price direction is more important than taking into account
[13:15] all the necessary factors when forming an order block. This is what you should start your analysis with if you want to have a high Win rate of working out your forecasts, but bullish order blocks that will form
[13:30] here or have already formed on this growth will not be considered simply because I expect the growth will not be considered simply because I expect the Lows to be updated at 28 thousand based on pricing on the monthly and weekly timeframes. Of course, they can
[13:44] get a reaction. Well, this will usually be either a small correction or consolidation before continuing the decline. I am often asked why here or another bookmaker order did not work if I took into account all the criteria for its formation. In
[14:00] 99 percent of cases, higher timeframes are not taken into account, that is, bias regarding the future direction of the price is not formed based on them. Attempts to open such positions in most cases will be unsuccessful. You will not be able to
[14:16] effectively use this tool and you will not learn to determine tool and you will not learn to determine which order blocks should be used and which ones are most likely to be broken. Also, consider this important
[14:28] factor: pricing often turns out to be symmetrical, that is, both a bullish and bearish order are immediately formed in a narrow range. Book, this video will stun you. If you do not have a bias regarding the future. Price directions from higher
[14:43] timeframes. What to pay attention to in this weekly range, the imbalance and liquidity. Here we see that the price in the deep Premium Market has updated the upper boundary of the range and
[14:56] has updated the upper boundary of the range and partially filled the monthly imbalance. We can also consider this green full-bodied candle as a bearish order book and the price has already tested it. After 9 from above and a test of the
[15:11] resistance zone in a bearish market, it will be relevant to wait for a deviation from below, that is, an update of this Low, where the correction began. Also, pay attention to a similar Range, only on a monthly timeframe. Its
[15:26] boundaries are marked in blue. After updating the old High, a bearish reversal formation formed and a descending order-fu began. The target, as with the descending order-fu began. The target, as with the weekly range, will be this minimum.
[15:41] relevant to consider only a short position with the goal of reaching the Pool in liquidity at 28 thousand. What are the expectations for the bullish order book that formed during
[15:55] book that formed during this growth? They will break through, but we can expect a slowdown in the fall when the price tests them. From them, it can the price tests them. From them, it can A correction or consolidation will begin, but as
[16:08] continue. Now, examples of a bearish order block, where it was determined by the shadow of the candles, which removes liquidity from the High of the previous week. In all similar situations, you can
[16:22] go to a lower timeframe and see that there will be two full-bodied candles in the form of a classic bearish order block. In my previous video, I talked in detail about the formation of different patterns depending on the timeframe.
[16:37] This will be well applicable when using an order block. Sometimes, to determine the correct boundaries of your zone of interest, you will need to look at different interest, you will need to look at different timeframes. Look at the two-day
[16:50] timeframe. Instead of the candle shadow, we already see an absorbed green candle that removed liquidity for buying with a maximum. And the previous week and the current year, a bearish balance was not formed here, the
[17:03] current year, a bearish balance was not formed here, the mandatory factors and they will not cancel the relevance of the order block.
[17:15] Specifically, in this case, the 4 most important criteria are taken into account: a test of the resistance zone, removal of liquidity for buying, absorption, and higher timeframes on which we formed a bearish Bias
[17:30] Bias now we move on to the 4-hour timeframe. The marked candle shadows are bearish order blocks, similar to the previous example. To find the classic display of each of the
[17:44] harder blocks shown, you will need to go to a lower timeframe. There you will see full-bodied candles that remove liquidity for purchase and are then absorbed. Let's start with the 2-hour timeframe. The
[17:59] full-bodied green candle, which is marked here, updates the liquidity of the current day's High and is then absorbed by the next candle. Here, too, a bearish balance is not formed, but this will not mean that an order block
[18:15] should not be considered. Usually, in such cases, the price will tend to fill the balance that formed inside the order block at the time of absorption from there, and a reaction will occur after updating this Low, which will be
[18:31] considered. The sum of the internal structure of the dream has adjusted to the range of 50 percent of the bearish order block, from where the Lutsenko asset continued. Please note that inside the order block, the price consolidates. This happens in
[18:46] most cases because the main goal of smart capital is to close an unprofitable Long position. And in order to close it, you need to sell. Therefore, liquidity is needed for purchase. which is formed here and subsequently
[19:01] updated, but it is worth considering that the price will not always consolidate within the order book. This usually does not happen if liquidity pools for buying were formed under the order block, which will be
[19:15] used to close a losing position. When opening a short position from this order book, take profits will be placed at the minimum from which the correction began and to fill the bullish balance below it. The
[19:30] fill the bullish balance below it. The next example will be seen fortunately. Here you can see the moment I already mentioned: the shadow of the engulfing candle is higher than the shadow of the green candle. The order block is always formed on extremes.
[19:46] Piglet, therefore, we must take this shadow of the candle into account to determine the upper boundary of the range simply because pricing is no different between this order block pricing is no different between this order block and this one. I often see
[20:00] that some traders, when they see a similar situation, mark only the green candle as their zone of interest, but exploratively place a stop loss above it. They are above the swing. Where the fall began, this often leads to them being
[20:16] knocked out by the stop loss. They continue the outgoing movement without updating the high-engulfing candle. Keep in mind that here the difference between the high of the green and black candles is very small. and it is not critical to make such a mistake, but in
[20:32] some situations it will be much greater, which will definitely lead to negative results. Well, to consolidate this, you can look at this order block. You see what is the difference between the high of the green and
[20:47] black candles. Let's then see what happens when we place a stop loss happens when we place a stop loss above the green candle.
[20:59] budge. Now you will say that there is no classic display of the order block because there was no absorption or something like that. Let's go to the two-hour time frame. And on this time frame, as we see, there is already one. And when you
[21:16] define the order block in this way, you understand the stop loss, and all because you simply do not understand the basic things of how candles are formed. The price of formation between the three order blocks shown is not different at all. The
[21:31] only difference is which time frame you are looking at. But I will say right away that switching to a bunch of different time frames is not necessary. After a little practice, you will be able to correctly determine the boundaries of the order book on standard time frames,
[21:46] but first I recommend looking for their classic display as shown in the diagrams to determine the boundaries of this To clear up any questions, we need to go to the 90-minute timeframe of the order book.
[22:01] Here you can already see a full-bodied growing candle that removes liquidity for buying from the previous day's high and then is absorbed. Now you have no reason to
[22:13] place a stop loss here and you will not be knocked out by an unjustified stop loss. As a result, the trigger point for the reversal was the previous order block that formed on the hourly timeframe and, let me remind you, it is located inside
[22:29] the order book on the two-day timeframe. The price manipulates highs in this range in order to close its unprofitable long position for the purpose of further assessing the asset. When opening a short position from the hourly
[22:43] order block, the initial target will be the minimum from which the correction began. It will be relevant to fix the bulk of the position, and the next goal will be to
[22:55] reach the first problem zone below it, this bullish imbalance. If you open a position based on this 90-minute order block, you can
[23:07] set the same targets, but here it is better to set a retake where the first profit-taking will occur when updating this The Loya where the correction of the this The Loya where the correction of the
[23:23] similar to other examples. When updating this Loya, the internal ascending structure was broken, after which a fairly rapid buyback began, where local liquidity for the purchase, which was formed before the
[23:37] order block, was updated and manipulation of the highs took place already inside. After which an aggressive decline began and an exit from this range, each shown zone of interest could be used to consider a Ford
[23:52] position when all the necessary criteria for the formation of an order block are taken into account and the work occurs towards higher timeframes, you will always see a very high probability of processing your transactions in this shown
[24:07] range. Of course, former flea orders were also formed, but they were not interesting to us because, based on our analysis of higher timeframes, we are bearish, that is, we are waiting for a markdown of the asset, they will be broken through, but before that,
[24:23] the Price may receive an insignificant reaction from them, Well, the last example of a bearish order block that I want to show
[24:35] was formed quite recently, you can see that here there was a withdrawal of liquidity for a purchase from the previous month or a balancing of the price after absorption, a bearish balance will be formed, therefore the boundaries will be
[24:51] determined by the shadows of the candle. On September 12, the Bull order was tested, after which the price aggressively continued to move in a downward direction.
[25:03] You can see in your public telegram channel. I often write my expectations for Bitcoin and other pairs, and this situation was no exception. I show the development of tools on YouTube after the fact in order to analyze the topics in as much detail as possible
[25:18] and not waste a huge amount of time on creating one video. But by going to the Telegram channel, you can see how effectively the concept on which I trade works. I remind you that the link is in the description under the video.
[25:34] Now let's look at several bullish order blocks. talked about the main nuances using examples with bearish order blocks.
[25:47] Therefore, I will not analyze each example in such detail here. The formed when the bullish daily imbalance was partially filled. This is the
[25:59] reason why it is relevant to consider any Long positions here. The black full body illuminates, removes the liquidity of the previous week's layer, and then is immediately absorbed and also breaks down. The bearish structure is
[26:15] all the criteria for order block formation here except one. The price did not leave the balance, as I already said, this will not be a factor. Why does our zone of interest lose relevance? In such cases, the price usually gets a reaction when the
[26:29] balance of the intrauterine book is filled on a lower timeframe, for example, on 4 hours after a small consolidation of withdrawals. An aggressive upward movement began inside the local Loyal order block, where the
[26:43] daily timeframe structure was broken during the correction, the price received a reaction from 50 percent of the previously tested order block. Another bullish order was also formed
[26:56] here. All the criteria we want to see when forming our zone of interest are already present. In both cases, Long positions could be considered, which ultimately worked out quite quickly.
[27:12] examples from the current range. A bullish order block formed during the test of another daily order block on the left side. After a small consolidation and the removal of short-term layers, the price inside it received a reaction from
[27:28] these values. Ascending pricing began. Pay attention to this falling candle. This is another former order block. Its classic display can be found on a lower timeframe. The subsequent price reaction on this
[27:43] small correction was precisely from it. Well, if you go to a lower timeframe, similar bullish order blocks, from which the price receives a reaction, and ascending
[27:59] the price receives a reaction, and ascending pricing continues. As you would notice, this is not a very complex topic. Order book is easy to find and effectively apply. The formation criteria are simple, but there are
[28:13] several nuances that still need to be taken into account. I recommend before Using theory on a real chart, conduct extensive work on history so that you can delve into the topic and understand how its boundaries are determined and in
[28:27] used. Remember that in addition to the criteria that form, you should always consider the general price direction from higher timeframes, otherwise it will not work as effectively as you would like. If
[28:43] you learned something new in this video and you liked it, then like it and write comments, because this will greatly help promote this video. And also, don't forget to subscribe to my Telegram channel (link in the description).
⚡ Saved you 0h 28m reading this? Transcribe any YouTube video for free — no signup needed.