

Smart Money Strategy Made Me Six Figures
44sHigh-earning claim and free strategy offer hook viewers seeking financial freedom.
▶ Play Clip"The title promises the only strategy you'll ever need, but the content is a solid, if familiar, supply-demand approach—not revolutionary."
This video presents a three-step smart money trading strategy that the creator claims has generated over six figures in the past year. The strategy focuses on identifying higher time frame trends, mapping supply and demand zones, and executing trades using a specific entry model on lower time frames. The instructor emphasizes patience, trend alignment, and risk management.
The strategy uses the 4-hour chart as the higher time frame and the 15-minute chart as the lower time frame.
Determine if price is bullish or bearish by identifying higher highs/higher lows (bullish) or lower highs/lower lows (bearish). Also identify if price is in a continuation or pullback phase.
On the 4-hour chart, identify demand zones in a bullish market and supply zones in a bearish market. These zones are where price is likely to reverse in the direction of the trend.
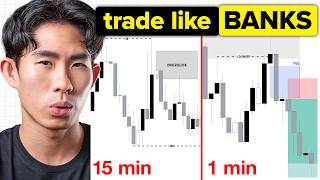
After price enters a demand zone, drop to the 15-minute chart. Look for a market shift (break of internal structure) and a liquidity sweep (sharp V-shaped move). Then wait for price to pull back to the demand zone that created the shift and enter a buy order.
Set stop loss below the demand zone. Take profit at either 1:3 risk-reward ratio or at the nearest opposing supply zone. Do not micromanage; set and forget.
Wait for price to reach your zones and for the entry model to appear. Do not force trades. Patience separates professionals from amateurs.
The three-step system—building a higher time frame narrative, mapping supply/demand zones, and executing on a lower time frame entry model—aims to align trades with the dominant trend. Consistent application and patience are emphasized for long-term profitability.
What are the two time frames used in this strategy?
4-hour (higher) and 15-minute (lower).
00:30
What defines a bullish market structure?
Higher highs and higher lows.
01:11
What is a 'break of structure' to the upside?
When price breaks above the last high, creating a higher high.
01:24
What is a 'market shift'?
When price breaks past the last higher low in an uptrend (or last lower high in a downtrend), signaling a potential trend reversal.
01:37
After a break of structure, should you enter immediately?
No, you should wait for a pullback to a demand/supply zone before entering.
03:25
In a bullish market, which zones should you trade from?
Demand zones.
04:33
What are the two criteria for the entry model on the 15-minute chart?
1) A market shift (break of internal structure). 2) A liquidity sweep (sharp V-shaped move).
10:59
What is a liquidity sweep?
When price briefly moves below a swing low to trigger stop losses of retail traders, then reverses sharply.
11:11
Where should you place your stop loss when buying from a demand zone?
Below the demand zone.
12:52
What are the two recommended take profit methods?
1) At a 1:3 risk-reward ratio. 2) At the nearest opposing supply zone.
16:08
Two Time Frame Approach
Simplifies analysis by focusing on higher time frame trend and lower time frame entry.
00:30Market Structure Basics
Reinforces foundational concepts of trends and break of structure.
01:11Patience After Break of Structure
Highlights a common retail mistake of entering too early.
03:25Liquidity Sweep Concept
Explains how smart money manipulates price to trigger stop losses.
11:11Set and Forget Discipline
Emphasizes the importance of not micromanaging trades.
17:17[00:01] smart money trading strategy that made me over six figures in the past one year this simple three-step system has allowed my students to generate consistent profits in the market and I'm going to give it to you for free cuz I'm
[00:15] the goats if you want to master this profitable strategy you must be willing to watch this lesson from the start to the end without skipping around now to keep things super simple we are only going to be using two time frames the
[00:30] time frame and the lower time frame will be our 15 minute time frame so the first step is to build your higher time frame narrative what we are trying to do here is to really come up with a story on what price is actually doing right now
[00:45] so that we can identify our trade buyers so the first question you want to ask so the first question you want to ask yourself is is price bullish or bearish so we know that price will not just go up or down in the straight line if price
[00:57] little bit and then go go up even higher pulls back a little bit and then goes up work right nothing will ever go up and down straight I know this might sound super basic but people need to be reminded more than they need to be tght
[01:11] right so in the uptrend we know that price is going to be creating higher highs and higher lows like what we have on the screen right here so when price break through the last High it creates what we call a break of structure to the
[01:24] upside right so this is our bullish breakout structure so if we were to map creating like I said higher highs higher lows leaving us a bullish breakout structure but we know that price will
[01:37] not go up forever at some point of time some sellers will come into the market and overwhelm the buyers and that is when price will come down there and break past the last higher low when this happens this is our Market shift and
[01:51] then this Market shift pretty much just tell us that price is reversing from a uptrend to a downtrend and right now we are about to turn beish and if price is starting bearish price will be creating your lower highs and
[02:05] screen right here right you can see lower highs lower lows once again is creating bearish break of structure to the downside and then eventually price will turn back bullish again when demand Ste into the market and overwhelmed the
[02:18] sellers and that is when we will get another Market shift where price break past the last lower high creating a new higher high and now we are officially bullish so this is just how the price move right this is just how the market
[02:33] understand right is to really identify whether price is bullish or bearish right now because we want to trade with the trend if price is bullish ideally we want to buy at all these higher lows and if price is bearish we want to sell at
[02:46] sick of hearing me repeat this like a thousand times by now but you must make sure you master the basics because if you don't you are essentially building a house on S and if some natural disaster come you just come and Wipe Out the
[03:00] entire house right so we need to have a solid foundation the second question you want to ask yourself is is price in the continuation phase or the pullback phase because after a break of structure we know that price is going to start
[03:13] pulling back and we need to have that at the back of our mind and a lot of people don't and a lot of retail Traders don't they assume that after price break going to continue going up like this in a straight line and they start entering
[03:25] for a buy Here buy Here buy here just for price to start pulling back and then wondering why the market is going against them so on and so forth after a break of structure instead of entering for a buy immediately remember we want
[03:38] to wait for price to pull back and then we will enter for a buy right here here guess what the stop loss must be below this last higher low and your risk is essentially much higher compared to if you're entering right here and you
[03:52] so that's the first step you identify whether price is bullish or bearish so that you know exactly which side of the market you should be trading with and the continuation phase or the pullback phase if price is in the continuation
[04:06] phase I would advise you to wait for price to start pulling back and start to create that new structure then you enter for a buy because ideally you want to trade with the trend after the pullback is over so for the second step we are
[04:19] still on the 4-Hour time frame and this is when you want to map out your supply and demand zones in the last video we have already taught you how to actually I'm not going to go through the entire thing again but basically you want to
[04:33] identify demand zones in a bullish market and you want to identify Supply zones in a bearish market because these are the zones that are aligned with our be able to trade with the trend right so using this example right here what we
[04:48] have was that price was going up and then it hit onto some unmitigated Supply Zone that we have on the left hand side and that is when Supply step into the market and that caus price to start turning bearish to First facilitate the
[05:00] pullback right so once price starts pulling back eventually it goes up there and break past the last High giving us a break of structure to the upside and now we know that we are in a continuation phase remember when price is in the
[05:13] continuation phase yes you can enter for a buy here and here but I would advise you to trade after the pullback is over so that you can get the optimum entry point eventually price will start pulling back again once again why is it
[05:26] Supply Zone that we have on the left market and cause price to start turning bearish now once the pullback start happening you will start to see price creating lower highs and lower lows on
[05:38] the lower time frames and at this point of time you must be aware of the higher time frame Trend and know that we are just turning bearish for a short amount of time to facilitate the pullback on the higher time frame Trend so you
[05:51] cannot assume that price is reversing into bearish right now because price has not took out this last higher low that means we are still playing within the swing High This is Swing Low and price is just turning bearish to facilitate
[06:04] the pullback so in this case since we are in a bullish Market where price is creating higher highs and higher lows we want to trade from demand zones right so based on this we are able to identify two demand zones this is the first
[06:17] demand Zone that was being created after price broke structur and then this is the second demand zone right which was created after price broke the internal structure right here on the lower time frame itself so now our job as
[06:29] professional Trader is to Simply wait for price to come back down to either one of these demand zones and then wait for our entry model to present itself and then that is when we execute our trade without hesitation reservation or
[06:44] fear so now this is where I would advise you to set the alert at the edge of the zone that you want to trade from and right now you might be asking me Brad so which zone is price going to respect and starts going up let me tell you the
[06:57] honest truth I am not a fortunate tell I don't have a freaking crystal ball I rest back and the thing is you don't need to know in order to make money you just need to wait for price to come down to either of these demand zones and then
[07:12] you wait for your entry model to present itself and then that is when you enter for the trade so step three is where you execute your trade after price has execute your trade after price has entered into your demand zone so at this
[07:24] point of time before we get too ahead of ourself You Must Be Wondering okay are price has done bearish to facilitate the pullback yes you can right so if you are looking to trade the counter Trend which
[07:36] means you are trading against the higher time frame Trend you are trying to capitalize on this shortterm pullback that we have right here yes you can enter for a sell here at all these lower highs right here but bear in mind you
[07:48] have to manage your expectation because the minute price enter into any one of that at any point of time right now price is going to switch bullish and it's going to cost price to continue to go up so the best way to trade counter
[08:02] Trend or rather the best time to do it is to actually enter for sell at the start of the counter Trend itself but the mini price enter into either one of these demand zones I would advise you to stop trading counter Trend and look for
[08:14] your pro Trend setups right look for your entry model so if you look at this screen and there's a black line right the black line basically represent the 4-Hour time frame and the Gray Line basically represent the 15-minute time
[08:28] frame which shows us what price is doing on the lower time frame and as you can see like I said earlier price done bearish right it created lower high internal structure on the lower time frame structure in order to facilitate
[08:41] the pullback of the higher time frame Trend and like I said we want to wait for this pack to be over demand step to the market overwhelm the sellers the supply that we have right here that is when we know that right now the internal
[08:56] structure the lower time frame structure has shifted from bearish to a bullish and the lower time frame trend is aligned with our higher time frame Trend and this is when we are able to capitalize on those high probability
[09:10] trade setups so in this case right what happened was that price came down into this recent demand Zone but it failed right so this demand Zone failed to do into the market what could potentially happen is that price would just continue
[09:22] with the higher time frame bullish or the flow but that did not happen this demon Zone failed and in the end price went down even further and came down to our extreme demand zone now bear in mind this extreme demand zone right here this
[09:36] is the last line of defense because if you look towards the left hand side this is the last swing higher low right this is the previous swing higher low which is the previous swing higher low which means this point has to hold in order
[09:50] for price to remain bullish in order for the higher time frame structure to that if price break through this last higher low what we have is a market shift which tell us that price is reversing from this uptrend to a
[10:04] downtrend right now and I know my drawing is extremely ugly but just bear with me a little bit because it will all make sense very very soon so knowing that this is the last line of defense we can be a little bit more aggressive with
[10:17] our entry so the minute price actually mitigates your 4-Hour extreme demand Zone you want to drop down to your lower time frame to actually look for your entry model now you might be wondering what does the entry model looks like
[10:31] secret Source right now so this is what the entry model actually looks like so facilitate the pullback and at some point of time we want to see signs that this bearish trend is over and right now
[10:46] price has shifted bullish and that is when we want to look for our Market shift right so bear in mind this is what price is doing on the 15 minute time goes up there and break past the last lower high creating a market shift which
[10:59] signal to us that right now the order flow has transitioned from bearish to bullish and right now we are about to go to the moon so that is the first criteria that must be fulfilled before you actually enter for a buy the second
[11:11] criterial is you want to wait for some form of liquidity to be swept you must understand that smart money they need to sweep liquidity before they can cause you don't understand liquidity here's a quick crash cost we know that above
[11:27] liquidity and Below every swing low that is available liquidity why because when a retail Trader enter for a buy right here that is when they will place their stop loss below this last low right so that is just available liquidity being
[11:42] sometimes they will push price down there purposely and manipulate price to sweep the available liquidity that we have below these lows before causing thing about liquidity Swip is that it
[11:56] usually comes in the form of a Sharp vshape reaction like this right you want to see price aggressively going out and aggressively coming back in so what started reversing right here right this is when it would induce the retail
[12:10] traders to actually enter for a buy position thinking that price is going to will place a stop loss below this low right here and that is when smart money liquidity stop them out stop these newbies out and then cause price to
[12:24] reverse and hit back up and that is when the real move is starting to happen and that is what we have a liquidity sweep so after you get your liquidity sweep after you get your Market shift that is when you want to be waiting very
[12:37] patiently for price to come back down to the demand Zone that actually created this Market shift and that is when you enter for your buy position this is where you get your Optimum entry point ladies and gents so you can either enter
[12:52] for a manual buy order or you can set the entry limit order on the edge of the Zone itself and then you need to make sure that you your stop loss below the Zone itself now looking at this entry model you might find that it looks very
[13:04] model you might find that it looks very familiar why is that because what we saw on the higher time frame is essentially the same thing this same exact entry model can be used on any time frame be a 50 minute the 4 Hour the daily or the
[13:16] 50 minute the 4 Hour the daily or the weekly whatever because price is fractal frame must first happen on the lower time frame whatever happens on the higher time frame must first happen on the lower time frame
[13:29] and the same pattern tends to repeats over and over again what's up bro so while editing this video I realized that I made a little mistake in the drawing guys are probably confused why is this circus and I'm pointing to this thing
[13:44] basically just know that you are looking for this entry model on the 15minute time frame over here right so there isn't supposed to be this little circus just to show you that okay that is a liquidity slip that's a second criteria
[13:57] the first criteria is a Market shift and just wait for price to pull back to the shift and you enter for a buy right there as simple as that now what this diagram is for is for those traders who want to analyze their charts on a 4our
[14:10] time frame which means all of these will be on 4our time frame and then once price mitigate the 40 point of interest you will jump down to the 15 minute time frame over here the minute it mitigated and then that is when you look for this
[14:22] on the 15 minute time frame right but let's just keep this strategy super simple and just stick to what I mentioned which is basically look for on the 15-minute time frame and then what wait for price to pull back to the
[14:35] shift and you enter up for a buy right there as simple as that no need to over complicate things here right yeah so this is more of like multi time frame aside for now all right now that you have understood what I'm basically
[14:48] watching the video so now that you have understood our entry model you will know that after price has mitigated our 4-Hour demand Zone that is when we want to look for our entry model right here but let's say for some reason you miss
[15:01] out on this entry model right this entry opportunity right here what do you do opportunity right here what do you do next you keep calm and collected and you wait for the next trading opportunity right the next trading opportunity will
[15:14] come after price goes up there and create the market shift once again breaking past the interna lower high and that is when you wait for price to pull back to the demand Zone that created the market shift and this is when the minute
[15:27] price come back down here to this demand Zone that is when you go down to the lower time frame once again to look for the same exact entry model that is why I say price is fractal because the same thing just keep happening over and over
[15:40] thing just keep happening over and over again and ladies and gents this is where you are able to get the high from the trade setups because now we know that the lower time frame is bullish the higher time frame is bullish and we got
[15:53] the multiple time frame alignment and that tell us that right now we are about to go to the Moon and right now we are about to print print some good ass money trade after you enter for the trade this is when you want to manage your trade
[16:08] step-by-step process on how we actually manage our trade first of all you'll be and demand Zone that you actually entered the trade on and if a take profit I would advise you to either take profit at plus three R which means the
[16:23] minute price reach one is to three like like this one is to three you get out of the trade or you can take profit at the nearest opposing supply and demand zone demand zone right we entering for a buy at this demand Zone we want to take
[16:38] profit at the nearest Supply Zone and if you're entering for a sell at a supply Zone you want to take profit at the nearest demand zone right so this is when you can potentially place your take profit at this nearest Supply Zone that
[16:50] we have on the left hand side that cause price to come down here and yeah that is so either take profit at a plus Street are or the nearest Supply in demand Zone and I would advise you to go and find out what works best for you remember
[17:05] data is King you need to really gather data to see which take profit method works the best for you and then stick to it consistently once you place your stop loss once you place your take profit set and forget don't micromanage it
[17:17] whatsoever don't adjust your stop- loss don't adjust your take profit trust your analysis because the minute you start adjusting your take profit making it wider or adjusting your stop loss making it further that is when you will start
[17:30] to incur large losses and small wins over the long run and that's not what we want because we want to be consistently profitable which means we want to make a money now that you have understood our three-step process let's go on to the
[17:45] charts and apply everything that we have learned so far to see how we can apply this entire strategy in real time okay before that let me drink some
[17:59] geek video without some tea it's like Batman without Robin or it's like having some fries without ketchup or chili it just doesn't make sense it doesn't exist your boy is in Ste all right all right so cool let's get on to the charts so
[18:13] structure to the upside because price cre a higher high higher low and then identify that this is the high until price starts pulling back all right so
[18:25] that is when you can start seeing price starts pulling back okay cool that is when we got a new high right here now remember after a break of structure we are anticipating price to start pulling back and right now we are still on the
[18:37] to the 15-minute time frame to look for our entry yet because price has not gotten into our Zone actually no we haven't even marked up the Zone yet right so we are still on a 4our time frame observing what price is doing step
[18:50] one building the higher time frame narrative right so at this point of time we know that we are officially in the pullback phase and price is in a bullish uptrend so you want to actually enter for a buy at a demand Zone but which
[19:03] demand zone are we trading from that is when you want to start marking up your demand zones right so what led to this break of structure there was this demand break of structure there was this demand zone right here right this entire giant
[19:15] consolidation and then demand step to the market and cost price to Skyrocket right so we know that this is uh one of our demand zone right so in this case this is the range method where we are marking up the entire consolidation or
[19:28] you can market up or rather just refine it to this pivot candle that we have right here all right so that is your first demand Zone the second demand Zone right here right so once again what do we have right here right are
[19:41] consolidating around here and then demand step the market and push price up one right here but you can see price is just completely disregarded so it Mark the first one since price has already disrespected it right so that is
[19:55] when you mark up this recent demand zone right this is where we got a consolidation demand St the market and boom demand push price up and then we also got our extreme demand Zone which is this one right here what happened was
[20:07] that price came crashing down right and then it started reversing and start heading back up right there so this is our extreme demand zone so now we got three demand Zone in place right here and we know that right now we are
[20:19] playing within this swing range right this is our swing low and then this is our swing high so Step One is done the step two is also pretty much done demand zones and we know that in a bullish uptrend we want to trade from
[20:34] demand Zone and the next thing you can potentially do is to set alerts at the edge of these zones right here so for those newbies who don't know how to actually set alerts on trading view you're dumbass no offense you just need
[20:46] to go to here press the alert and then press this plus button and it allows you to create alert and that is when you just want to input the price point that you want uh the notification to be triggered on and then once price get to
[21:00] will send you a Alert in the form of either SMS or email that tell you hey point you can go up there and analyze the charts that's what alert does and then the next step is to just do nothing and waits and this is when so many
[21:16] Traders mess up they start taking a bunch of Trades they start forcing trades even though there's no opportunity because they're not patient them right so at this point of time let's just wait for price to mitigate in
[21:28] one of this demand Zone before we determine the next cost of action boom that is when price came into this nearest demand Zone all right so at this you want to drop down to the 15minute time frame to look for your entry model
[21:42] and if we don't get our entry model whatsoever that means price is potentially just going to disrespect this demand Zone and come down to the next demand zone right and then that is when we just continue waiting until
[21:55] eventually we get our entry model we get the market shift that tell us that the internal structure the lower time frame structure have shifted bullish this is your 15-minute time frame the lower time frame and let's just observe to see
[22:08] whether our entry model present itself right let's see whether this demand Zone right let's see whether this demand Zone actually hold okay cool nope nope you can see it completely just blew right past it so we know that this is not the
[22:21] so we can just delete it cool let's go back up to the 4our time frame and continue waiting like I said patience is the name of the game this is what separates professionals from retail
[22:33] amateur Traders you guys just like to rush things because you want to get rich ASAP no just be patient all right so you can just wait price just blow right past this point of Interest as well but this is when we start getting some form of
[22:48] Market shift you can see this is where demand step into the market and overwhelm the sellers right just by looking at the kesic we know that a lot cool let's just jump down to the 15minute time frame since price has
[23:01] already mitigated this this demand zone right so let's just go down there and this is when we want to look for the market shift remember we want to see our entry model present itself right so over here this is when we know that okay we
[23:16] got our entry model right here okay so over here price has already mitigated this demand zone right and that is when we are looking for our Market shift now how do we know the market shift has happened we just continue to map out the
[23:30] frame structure we know that this is the internal break of structure to the downside right you can see price has just been creating a bearish break of this is the last bearish break of
[23:42] last bearish break of structure we can identify that the highest point is basically this area right here so this is the last swing high right so this is the last High and the minute price actually broke past the last high that
[23:57] actually broke past the last high that is when we got our Market to be valid the Candlestick must close below the last low right so that is why in this case right here when price came down here break past this last low it
[24:12] did not close below it right it's just a Candlestick Wick break so it does not count as a valid break of structure so later on price actually did close below the last low so this is the last valid break of structure and once again to
[24:25] determine your last High you just draw a box right from the last low to the point then you just drag it all the way up there and you determine the highest point which is this one right here so this is actually your last lower high
[24:40] and since price has just broken past the last lower high that is when we got our Market shift that is the first criteria right so the first criteria has been met criteria is that we want to look for some form of liquidity to be swept and
[24:55] once again you want to ask yourself and once again you want to ask yourself where is the available liquidity and remember I said that below every swing low there is going to be available liquidity right so based on this we know
[25:07] that over here where price came down into this demand Zone and started reversing this is when most retail Traders they will start entering for a stepping to the demand zone They enter for a buy and happy gol lucky thinking
[25:20] that price is going to go up right now and then they place a stop loss below this last low right so that is available liquidity below this this low right here that potentially price is going to come down there and sweep the available
[25:35] liquidity before it started reversing and that is when later on price actually and that is when later on price actually did came down here right reverse and then came down here again swep all the available liquidity below this lows
[25:47] right here trigger out all the retail Traders stop- loss and that is when price reverse and hit back up you can see this is a very sharp v-shaped movement now after this liquidity sweep after this v-shaped reaction what does
[26:00] this tell us this tell us that the smart money they have entered into the market now as retail Traders we want to trade with the smart money we want to follow their Footprints so this was the second criteria was that liquidity sweep so now
[26:13] that we got our liquidity ship and we got our Market shift the next step is to wait for price to come back to the demand Zone that actually created this identify the demand Zone that created this Market shift and you'll be this
[26:27] consolidation right here you can see this is where price consolidate here a little bit before demand step to the market and push price up so this is when demand Zone that created the market shift and that is when you can place
[26:40] your entry order your buy limit order at the edge of the Zone itself place your stop loss below the zone as for your take profit like I said you can either put it at 1 is to 3r which is somewhere right around here one is the three r or
[26:54] you can place it at the opposing Zone which in this case is is a supply zone right so in this case I will actually mark this up as the nearest Supply zone so this is our nearest 15 minute Supply zone right there right so like I said
[27:09] either place it at 1 to three hour or place it at the nearest Supply zone right and now we just wait for price to come back down here to the demand Zone and Trigger us into the trade itself right so you can see price consolidating
[27:21] patient you know you are trusting in your plan and boom that is when you get into the trade right there so right now your buy order has been triggered you have placed your stop loss below this last demand Zone what next set and
[27:35] forget you have placed your stop loss you have placed your take profit you your analysis you have waited a few hours for this entry model to present itself now just wait for the trade to play out right once again you can see
[27:49] this is what makes trading so hard is the waiting the fact that you cannot do anything and the fact that the market is an irrational uncontrollable unpredict ictable beast and there's nothing you can do about it so place a stop loss
[28:02] place a take profit set and forget let's see how this trade play out boom there see how this trade play out boom there we go as simple as that ladies and gents now we have hit out takech profit we can go pop a nice champagne or so and call
[28:15] it a day and then reset and look for the next trading opportunity now once again why is this considered as a high property setup because the lower time we gotten this Market Market shift and the lower time frame is aligned with our
[28:30] higher time frame Trend which is bullish so if you want you can even be more so if you want you can even be more ambitious to Target this 4our swing high but I wouldn't recommend you to to do this unless you have a lot of experience
[28:42] that price can start to turn bullish and just goes up like this and reach this starts coming down and just continue to consolidate around here that is when I don't want you to be stuck in this little consolidation for weeks right I
[28:57] just want you to get in and get out of the market fast but not too fast and yeah that's basically how you utilize this three-step simple system so now let's say for some reason you actually didn't manage to get an entry here
[29:11] didn't manage to get an entry here what's the next window of opportunity again to wait for price to pull back because right now we know that right now price has turned bullish right and we know that this is our new higher high
[29:24] and this is our new higher low and right now price has just created another bullish break of structure to the upside and after break of structure we know back and where is it going to pull back to it's going to pull back to some sort
[29:37] of demand zone right so in this case this is the entire demand Zone that led to this break of structure right so that is when you can place another buy order right here at this new demand Zone and then simply wait for price to come back
[29:53] down mitigate this area right here and that is when you enter for a buy is the same thing like I said earlier price is fractal if you look at this we literally did the same thing on the 4our time frame right so just wait for price to
[30:05] created this break of structure and then for you to get trigger into the trade so this case just wait wait boom that is when you get triggered into the trade right here at the edge of the Zone once again and you place your take profit
[30:19] either at plus three R right like what we've done right here plus 3 r or at the nearest Supply Zone which would be this Supply zone right there and then just wait for price to play out and there you have it as simple as that guys I'm
[30:32] this is how you really capture those High property setups right because what happens is really the lower time frame right now is bullish the higher time frame is bullish and that is when we are able to capture these nice nice nice
[30:45] setups so if you still don't get it I would advise you to rewatch this lesson over and over again until the concepts get embedded into your subconscious mind and then that is when you are G one step closer to Mastery so in the next lesson
[30:59] I'm going to show you the exact blueprint that's allowed my students to become six figures funded Trader they able to pass 100K funding challenges with ease using this exact strategy right which I'm going to review in the
[31:12] next lesson so if you don't want to miss out on the next lesson make sure you notification by pressing the freaking Bell below and I sound like a stupid do that in order to get notified when the next lesson drops and if you still
[31:25] please go and watch this lesson right here and as always remember you are just here and as always remember you are just one trade away



⚡ Saved you 0h 31m reading this? Transcribe any YouTube video for free — no signup needed.