

The Hidden Power of Failed Zones
45sExplains a counterintuitive concept that failed zones reveal market shifts, sparking curiosity.
▶ Play Clip"Delivers a thorough, structured lesson on flip zones with clear examples, though it could be more concise."
This lesson explains flip zones, a concept in supply and demand trading. A flip zone is a supply or demand zone that causes an opposing zone to fail, signaling a shift in order flow and market control. The video provides a systematic framework for identifying valid flip zones and demonstrates their application with chart examples.
A failed supply or demand zone can reveal a shift in order flow, indicating whether demand has overpowered supply or vice versa. This is the basis for flip zones.
Flip zones are supply and demand zones that cause the opposing zone to fail. They signal a shift in order flow and are caused by changes in market sentiment, order flow, and participant psychology.
There are two types: supply flip zones and demand flip zones. A supply zone leads to an aggressive move down, while a demand zone leads to an aggressive move up.
Flip zones help traders understand when the previous trend is weakening, when the opposing side has stepped in with strength, and where a new point of interest may form after a zone fails.
A supply flip zone forms when a demand zone fails to create a higher high in an uptrend. This indicates that supply has overpowered demand and sellers are taking control.
For a supply flip zone to be valid, price must break and close below the reaction point (the previous low) and lead to a market shift or break of structure.
A demand flip zone forms when a supply zone fails to create a lower low in a downtrend. This indicates that demand has overpowered supply and buyers are taking control.
A zone reacting is not enough to call it a flip zone. The opposing zone must fail to do its job, and the price must break structure and close beyond the reaction point.
A flip zone is only confirmed when there is a failed reaction, price breaks structure, and price closes above or below the reaction point.
The video provides a step-by-step framework: map out structure, identify supply/demand zones, wait for a failed reaction, confirm with a break of structure and close beyond the reaction point, then draw the flip zone from the high to low of the failed reaction.
Flip zones can be subtle and are easier to spot with practice. Higher timeframe flip zones outweigh lower timeframe ones, as explained in the multi-timeframe concepts lesson.
Flip zones are supply and demand zones that caused the opposing zone to fail. They indicate a shift in order flow and help traders understand who is in control of price.
Flip zones are a powerful tool for identifying shifts in market control. By confirming a failed reaction, a break of structure, and a close beyond the reaction point, traders can add this confluence to their trading plan.
What is a flip zone?
A supply or demand zone that causes the opposing zone to fail, signaling a shift in order flow.
01:01
What are the two types of flip zones?
Supply flip zones and demand flip zones.
01:42
What causes a flip zone to form?
Changes in market sentiment, order flow, and participant psychology.
01:16
What is the first criterion for a valid supply flip zone?
It must cause a demand zone to fail.
17:14
What is the second criterion for a valid supply flip zone?
Price must close below the reaction point.
17:27
What is the third criterion for a valid supply flip zone?
It must lead to a break of structure or market shift.
17:41
How is a supply flip zone formed?
When a demand zone fails to create a higher high in an uptrend.
03:27
How is a demand flip zone formed?
When a supply zone fails to create a lower low in a downtrend.
06:25
What does a failed demand zone indicate?
Supply has overpowered demand, and sellers are taking control.
05:45
Why is a zone reaction alone not enough to call it a flip zone?
The opposing zone must fail to do its job, and price must break structure and close beyond the reaction point.
07:44
What is the systematic framework for identifying flip zones?
Map structure, identify zones, wait for failed reaction, confirm market shift, draw the flip zone from high to low of the failed reaction.
12:51
Definition of Flip Zones
Provides the core concept that flip zones are zones that cause opposing zones to fail, signaling order flow shifts.
01:01Supply Flip Zone Formation
Explains the specific condition for a supply flip zone, linking it to a failed demand zone in an uptrend.
03:27Criteria for Valid Supply Flip Zone
Establishes the necessary conditions for a valid flip zone, making the concept actionable.
05:45Zone Reaction vs. Flip Zone
Clarifies a common misconception, emphasizing that a reaction alone is insufficient for a flip zone.
07:44Systematic Framework
Provides a step-by-step method for identifying flip zones, reducing guesswork.
12:51Summary of Flip Zones
Recaps the entire lesson, reinforcing the key takeaway that flip zones indicate shifts in market control.
29:37[00:02] And one of the most important clues is not just when a zone works, but when it Because when a supply and demand zone fails in the right way, that failure can reveal a shift in order flow. It can tell you that demand has overpowered
[00:17] supply or supply has overpowered demand. And that is what flip zones help us So, we've already talked about supply and demand zones and how they help us identify where price is most likely going to react. But in this lesson, I
[00:32] want to show you something just as important, which is what happens when one of those supply and demand zone fails. Because a failed zone is not always meaningless. Something that fails tells
[00:45] overpowered it. Demand has exceeded supply, the buyers has took back control of price from the sellers or vice versa. And that is once again where flip zones come in. So, what are flip zones? What are these magical
[01:01] zones that you're talking about, Brent? Flip zones are pretty much the supply and demand zones that caused the opposing zone to fail. They signal a shift in order flow and tell us whether demand and supply has
[01:16] overpowered the other side. And they are usually caused by changes in the market sentiment, changes in order flow, and changes in the order flow, and changes in the psychology of market participants.
[01:29] So, a flip zone is not just a zone that has failed. It's a failed zone that reveals a change in control, the buyers and the sellers, whoever took back control of price. So, that's what flip zones allow us to
[01:42] Okay, so there is two types of flip zones. There's your supply flip zone and zones. There's your supply flip zone and then there's your demand flip zone. So, supply zone is like what we have went through in the first first few
[01:55] point of interest that led to an aggressive move to the downside. And then a demand zone is pretty much a aggressive move to the upside, right? Really gotten that out of the way. If
[02:08] you don't understand so what are supply and demand zones and how to identify and trade them, please go and rewatch that lesson before you come on to this lesson itself. Flip zones are pretty much the zone that
[02:20] caused that particular supply or demand zone to fail. And the reason why they matter is because they help us understand when the previous trend is weakening. You know, when the sellers are getting weaker and
[02:33] market. They help us understand when a zone has They help us understand when the opposing side has stepped into the market with a lot of strength, a lot of momentum, a lot of intent.
[02:48] And they help us understand where a new point of interest may form after it has Okay? So, it pretty much tells you that the market is no longer respecting the old narrative. So, if the market has been bullish for quite some time and you
[03:02] start to see the demand zone fail, this tell us that sellers might be stepping into the market to take back control of price. Similarly, if the market has been bullish for quite some time and then you start to to see uh no, similarly, if the
[03:15] market has been quite bearish for quite some time and then you start to see the sellers start to fade away, they are start to weaken because the supply zone start to fail, this is where we know for a fact that the buyers are taking back
[03:27] control of price. So, supply flip zone So, supply flip zone is formed when a demand zone fails to do its job and create a higher high in an uptrend.
[03:40] that if you look at this example right here, price goes up, pulls back, goes up creating a higher low, right? This is a bullish break of structure which tells us that price is actually in an uptrend. So, right now we are expecting price to
[03:53] create a new higher low and then go up there and create a new So, we are expecting this demand zone to hold, right? So, if that demand zone hold, this tell us that the market is still bullish and
[04:06] up. But, observe what happened next, right? So, in this case, price went down, mitigated the demand zone, right? So, it the remaining buy orders that was pending at this demand zone, but there
[04:21] was insufficient demand. As a result, price created a new lower and then later on price went out there and take out the last low, giving us a market shift. So, in this case, this is what we call a
[04:34] which is when price actually wanted to go up, but there was insufficient liquidity, insufficient fuel, insufficient demand. As a result, not enough fuel, it came down and caused the entire trend direction to shift.
[04:50] So, basically, like I said, if this demand zone were to do its job, it would low, and create a new higher high. But, in this case, it failed to actually create a new higher high. It failed to take out this high right here, which
[05:04] tell us that this demand zone has failed. when there's a failed reaction just like this, this is where we can draw the flip
[05:16] zone, right? Which is from the bottom to the top of the failed reaction, and this the top of the failed reaction, and this is our supply flip zone.
[05:28] just identify the range that was created after the zone has failed, and that is your flip zone itself. down here, taking out this low, telling us that supply has overpowered demand,
[05:45] the sellers has overwhelmed the buyers, and right now the sellers are in control and right now the sellers are in control of price. Price must break and close below the reaction point. Must break structure in
[05:59] actually be formed, right? So, these are like the two criteria, which means that the there must be a nice candlestick closure below the previous low right here, and it must also lead to some form of market shift or some form of break of
[06:11] structure for us to deem that as a valid supply flip zone. So, a demand flip zone is pretty much the opposite of that, right? Demand flip zone is formed when a supply zone fails to do its job and create a lower low in
[06:25] a downtrend. So, once again, in a downtrend just like this, we are expecting price to create a lower highs and lower lows. So, we naturally expect price to mitigate the supply zone, and then for sellers to
[06:37] come down there and take out this low right here. not happen because there's not enough sell orders within that supply zone. As a result, it creates a failed reaction just like this. When we have a failed
[06:52] reaction, which tells that price didn't have enough sell orders to cause price to continue going down to take out this low right here, instead it actually reversed to the upside. This tells us that we have a flip zone. Okay? This
[07:04] tells us that the supply zone did not do its job. It failed to do its job, giving us a failed reaction, which allows us to draw a flip zone. failed reaction to the bottom of the failed reaction.
[07:17] And right now we can expect price to pull back to the flip zone after the market shift to fill up the remaining buy orders before continue to the Okay? So, you can actually look for shorts at this supply flip zone and look
[07:31] itself. As simple as that. Once again, this just tell us that, you know, the opposing side has actually took back control of price. Now, I want to emphasize on this point
[07:44] right here, okay? If you look at this move over here, you must understand that a zone reacting is not enough to call it a flip zone. Okay, so if price comes up here, mitigate this supply zone, and goes
[07:58] down, this is not a flip zone. For it to be a valid flip zone, it needs to have the opposing zone failed to do its job, right? So, in this case, the only reason why we can call this a flip zone and not just an ordinary demand
[08:10] zone is because it causes this supply zone to fail. job, which means we got a failed flip zone. And And to be very specific, it's our
[08:23] demand flip zone. And it also caused price to break this relevant structural point. So, that's another important thing, right? structure. So, if this flip zone did not break
[08:37] zone. And another thing is that it needs to and close beyond the reaction point, right? So, this is the last high right here. It needs to have a nice candlestick closure above that last high
[08:52] Okay, so once again, just a quick recap. A flip zone is only confirmed when there is a failed reaction, when price breaks structure, and price actually close above the or below the reaction point.
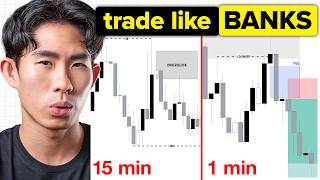
[09:08] flip zone. Now, let's take a quick look at some examples on what this looks like on the chart, right? So, in the In this case, got a supply flip zone, and then on the right-hand side, we got a demand flip
[09:21] So, what happened is that price went up, pulls back, goes up. Guess what? You got a demand zone being formed right here. assuming that the market is to remain bullish, what must happen is that price
[09:34] higher low, and respect this demand zone, buy orders must be so much buy orders that cause price to later on go up there, break structure, and create a higher high. If that does not happen, if price failed
[09:49] to take out this high high right here, and instead cause a failed reaction, we and instead cause a failed reaction, we know that supply has overpowered demand. right now the trend is about to shift from bullish to bearish.
[10:04] down there, take out the last structural low right here, giving us a market shift, confirming to us that shift, confirming to us that price is indeed shifting bearish.
[10:16] Now, notice that when price actually have a failed reaction right here, okay? Over here. This does not necessarily mean that the market is about to reverse. Because as long as price is still respecting this last higher low,
[10:30] means that price can pull back to this demand zone right here, you know? But does not take out that demand zone, and instead just start reversing up just Which means this right here is not a valid flip zone.
[10:45] Because it did not lead to a break of structure. It did not lead to a market structure. It did not lead to a market shift. market shift right here, and this give us our supply flip zone, which we can
[10:58] identify by drawing the high to the low of that failed reaction, drawing a box just like this, and this is where you got a flip zone. All right? So, you just zone, and then this way you can look look for shorts. Same thing as the
[11:11] demand right here, right? Supply zone failed, creating a failed reaction right price to pull back to the flip zone, and we look for our long position, and buy it all the way up. As simple as that.
[11:26] like I said, I don't always like to have you guys memorize that you don't understand. So, once again, I just want to explain the logic, the psychology behind the flip zones. Flip zones are caused by a change in
[11:39] market sentiment and participant psychology. For example, in this case, the traders right here, you know, when like this, they're obviously expecting this demand to hold.
[11:55] But, when it didn't hold, and instead it failed, this invalidation fuel was the move in the opposite direction. So, this was like
[12:08] a sign that tell us that the confidence have shift from the buyers to the have shift from the buyers to the sellers. clue that tell us that the control has changed.
[12:21] The buyers are no longer in control of price, the sellers are now in control of price. So, this failure of a particular zone of this demand zone tells us that the sentiment of the market has changed.
[12:36] The belief has changed. And since the belief and the sentiment And since the belief and the sentiment has changed, the order flow has changed. With that being said, let's go on to the charts and try to identify some flip
[12:51] All right. So, I'm once again, I'm going to give you like a very systematic framework that you can use to identify these flip zones because I want to make it as mechanical as humanly possible so that there's no room for guesswork or a
[13:05] doubt whatsoever. And that usually comes down to just a show you in a minute. So, let's Okay, so these are already some flip zones I've marked up for you. Let me just remove everything and let's
[13:18] just go step by step. Okay, step by step. we have going on right here. First step, do your mapping out of your structure, right? So, this is the bullish break of structure. This is the
[13:31] swing high or this is the swing low and this is the swing high. Okay, so we can structure. So, this is the range that we So, this is where we can map out our demand zone, which is this entire range
[13:45] method, it would just be the pivot candle right here. But, for simplicity's sake, let's map out this entire range right here. So, this right here is our demand zone.
[13:59] Okay? So, right now price is bullish, creating expecting this demand zone to hold and we are expecting price to come down here go up even further. That should be clear by now. If that's
[14:12] still not clear, please go and revisit the past few lessons. Okay, we wait, we observe what price is doing. Price mitigate this demand zone right here. Bam! And then creates a fair reaction. Okay,
[14:26] so that's the first step, right? The first step is to identify the structure supply and demand zone that you can spot. ideally we want to assume that this zone is just
[14:40] work, then it gives us a fair reaction, then now we know that the sellers has overpowered the demand, the the buyers. So, in this case, price mitigate this demand zone right here. Now, our expectation is that price is going to go
[14:53] expecting right now. Price is going to go up. Okay? And then price did go up. this supply right here, and then started coming down a little bit. No worries, right? That might just just be a little pullback for price to continue going up
[15:08] So, in this case, we just wait, wait. Boom! And then the price came down and what do we have? We got a fair reaction. Now, this just tell us that smart money institutions, they have used the buy
[15:21] orders within this area, but there was insufficient buy orders for price to continue going up to take out this high right here. So, as a result, it might It might. We cannot assume yet, right? Because there is no market shift
[15:37] low. So, this could just be, you know, price pulling back, maybe coming deeper into this demand zone, and then goes up. Okay, so this is just a first sign that tell us that it might fail. And then in this case, let's just
[15:50] things. Boom. Price came down and take out that Okay, the minute it take out that low right there, this is where we know for a fact that we got a market shift. Okay, so the minute
[16:04] a candlestick close below this previous swing low right here, we already got a market shift. Now, this is where we can start to identify our flip zone. Your flip zone is basically
[16:19] in this case, the supply zone that caused this demand zone to fail. few flip zones right here if you were to So, first of all, let's see the pullback. Price goes down, pulls back,
[16:35] and then goes up. So, let's look at this supply zone right here. Is this a flip it's not a flip zone. The reason why it's not a flip zone is because it did Right? If you look at the left-hand side right here, look, was there any demand
[16:48] zone that price reacted from? No, there wasn't. So, if that's the case, this is Now, then later on price continue going down, and then pulls back, and then goes can map out another supply zone right here.
[17:00] Now, is this a flip zone? Well, let's go through the three criteria that we have laid out earlier. Okay, so for this to be deemed as a flip Okay, so for this to be deemed as a flip zone, what must happen is that
[17:14] it must cause a demand zone to fail. Okay, so in this case, this supply zone, did it cause this demand zone to fail? Yes, it did. Right, because when price reversed, did not take out this high, did not do its job, and instead just
[17:27] Cool. Did it close below the reaction point? Right, so this is the reaction point. right here? Well, yes, it did. It did close below this low right here.
[17:41] Second criteria check. Third criteria is did it lead to a break of structure or a market shift? Later on price came down here, also led to a market shift. Yes, it did. Making this a supply flip
[17:58] All right, so that's my supply flip zone right there. fail, then it would just be a supply zone. But in this case, this zone caused other two criteria that we just talked about, making this not just ordinary
[18:14] supply zone, but a supply flip zone. Now, let's look at look at these other examples right here. Price continued going down, pulls back, comes down. So, in this case, we can map this up as a supply zone, right? And ask ourselves,
[18:28] is this a supply flip zone? Well, did it get a reaction from the left-hand side? Yes, it did. Right, it reacted from this demand zone that we have right here. And then also it met the other two criteria when it actually went down and
[18:42] failed reaction where the candlestick actually took out the reaction point, and also led to a market shift. Okay, so doing that alone, these two are our flip zone right here. Supply flip zone one, supply flip zone two.
[18:57] price does next, okay? So, later on price actually went up, mitigate that flip zone, and then started coming down. Okay, so two When price came up to this supply flip zone, it reacted from this supply flip
[19:13] But there was not enough liquidity, right? So as a result, it just continued blasting right through it. And it went up there, swept the liquidity above this fair reaction, and then pushed to the downside. Right? So in this case, not
[19:26] enough liquidity at the flip zone, guess where it needed to sweep liquidity. side liquidity. Well, it's going to be above this swing high. And that's what right? That's why I say you got to watch the lessons in chronological order. And
[19:41] lesson to the next lesson. Because the minute you skip one lesson, the next sense anymore. Because every single lesson is built on top of the last lesson. Right? So please, if you guys haven't went through the liquidity
[19:53] concepts and inducements lesson, go and rewatch the lesson because it's so You need to understand that before you can even fathom what happened right here. Why did price freaking flip the flip zone? Well,
[20:06] it's because there was not enough fuel within this flip zone. So as a result, it needed to grab more fuel above this swing low, swing high right here. happens next. Later on, price came up here.
[20:18] Mitigate this flip zone, come to the 50% of the flip zone, and then consolidate a little bit before it started dumping very aggressively. Right? So you can see this flip zone clears day. Judging by this huge move to
[20:32] the downside, clearly tells that this flip zone has done its job. This flip just so much sell orders within this area. It's actually diabolical.
[20:46] flip zone. Let me just try to show you guys some more examples. Let me show you like a much more subtle example. Right? So let's zoom in at price action that we have going on right here. Okay? So you can see price came
[21:01] there's a flip zone being formed right here. You might not be able to see it right now because you haven't got used to seeing it. Right? But because I've often by now, I can just see that there's a flip zone going on right here
[21:15] lower time frame. So, let's jump down to the lower time time frame. And look at what happened right here. supply flip zone. Now, let me show you an example of a demand flip zone.
[21:30] So, in this case, price broke structure right here, later on broke structure again over here. Okay, lower highs, lower lows, our good old bearish break of structure right here, which tells that this is the swing high,
[21:46] and then this is the swing low. Okay, let's just go back in time a little bit right here. Swing high, swing low. Cool. And then this is where you can map this up as your supply zone. All right. So,
[21:58] once again, our expectation is that price is just going to come up here, respect this last lower high, respect this supply zone, and price is just going to continue bearish. That's our expectation right now.
[22:11] not, it depends on what the market does, right? And what do we have over here? Okay, what do we have here, ladies and gentlemen? So, in this case, we got price going up
[22:24] there and take out the last lower high. You can see, clear as day, the candlestick closed above the last lower high, which means that we got a market right here. But was there a flip zone right here?
[22:38] Right? There was this demand zone right here, right? But it didn't really cause any zones to fail, right? It's neutral, right? So, that's all it is. There's no failed reaction, no flip zone, as simple as that. Let's continue to observe what
[22:52] price does. Later on, price pulled back to this extreme demand zone that we have marked up, got a reaction from there, and then as a result, pushed Now, this is where things start to get interesting
[23:04] here. Are you able to see the failed reaction? able to see it? Okay, so in this case, price reacted from this supply zone on right here,
[23:18] causing a pullback, and then later on price went up, giving us a failed reaction. Because if this supply zone were to do its job, and take out this low right here and continue bearish. But instead,
[23:32] it created a U-shaped reaction, V-shaped reaction, creating a failed reaction. Right, so this is the failed reaction, and then can see the candlestick close above the reaction point.
[23:45] point to make it more obvious for you guys to see. And this is where we can map this entire thing right here as our flip zone. thing right here as our flip zone. Right, so you map the high to the low of
[23:57] the failed reaction, and this right here, ladies and gentlemen, becomes our flip zone. Okay, this is our flip zone. candlestick closed above the reaction point, check.
[24:11] demand zone caused this supply zone to fail, check. Did it lead to a break of structure? Yes, it did. Broke structure by taking out this previous high right here. Right, price created higher high, higher
[24:23] low, and a new higher high right here. So, that's a valid flip zone. That's a valid demand flip zone, and look at what price did. Price pulled back to the flip zone and then pushed to the upside. Right, you
[24:35] can see. Observe where price pulled back to. After price made its move to the upside, came down, touches the flip zone right came down, touches the flip zone right here, and then goes to the upside.
[24:49] And interestingly enough, there's actually another flip zone which is not So, when you're asking yourself whether there's a flip zone, you just want to actually cause any opposing zones to fail.
[25:03] So, if I'm asking myself, is there a demand flip zone? see whether it has any supply zone that failed in the So, this is where you look to the to the left. Okay, price goes up,
[25:17] comes down. Okay, this entire range right here will be our supply zone. Right, so there we have our supply zone, and then we drag it all the way to the right-hand side right here. Maybe this entire range is a supply zone, just like
[25:30] this. Okay. So, in this case, price actually mitigate this supply zone that we have on the left-hand side right here. job, price would just go down and take out this low.
[25:43] Continuing this lower high, lower lows dynamic, but it failed to do its job, giving us a failed reaction, where price actually reversed and hit back up. Now, don't get me wrong, right? It did did its job to a certain extent. Right,
[25:56] price did mitigate its sell orders. Uh this What What was that? Price did mitigate this supply zone right here, and it did get a reaction. Right, like price did went down, but there was not enough fuel. There was not enough
[26:09] supply. There was not enough sell orders for price to just continue going down. Instead, it just reversed and hit back up. So, in this case, we got a failed reaction right here. And since we got this failed reaction here, this is where
[26:23] we can identify the reaction point, drag it from the high to the low, and this, it from the high to the low, and this, ladies and gentlemen, is our flip zone. And now you can see where price reacted from before it continued going up.
[26:39] Right, before price actually went up, it came down, mitigate this flip zone right here that we have identified 50% of it, and then continue pushing to the upside.
[26:54] will start seeing flip zones everywhere, right? Because of supply and demand zone failing, because there's just in terms of order flow, right? There's just the buyers and the sellers changing
[27:08] just the buyers and the sellers changing hands and it happens all the time. example right here. Maybe one last example. Over here, price goes up, pulls back, goes up, we got
[27:21] demand zone right here. Okay, we got a good old demand zone over here. mitigated this demand zone. Over here, you can see this long lower wick right here, which tells that price did mitigate the demand zone.
[27:34] job, price would just continue going up there, take out this high and just But instead, price actually reversed and head back down, creating a failed reaction just like this, guess what? We can map this up as our
[27:49] flip zone. Okay, so that's becomes another supply flip zone. And look at what price does. Okay. Price came up, gravitated towards this
[28:01] but this is one of those instances where the flip zone actually failed. just, you know, actually just start to Like you can see price did mitigate this supply flip zone. We did got a small
[28:16] not enough sell orders at this flip zone. As a result, price just blast And you might be wondering, why is that the case? It's because price has literally just reacted from this 15-minute flip zone.
[28:31] And remember in the multi-timeframe concepts lesson, we talked about how the higher the time frame, the stronger the price action is. So, if I see a flip zone on the 15-minute time frame just like this,
[28:44] this price action is going to outweigh any flip zone that was formed on the 5-minute time frame. Okay, so in this case, this 15-minute flip zone will outweigh this 5-minute flip zone.
[28:57] So, price is most likely going to respect this flip zone, this demand flip zone, than this supply flip zone right here. So, you can see, you literally apply the same principles, but just because the
[29:09] context is different, the time frame is different, you get two different move. One in which price actually respected and just caused price to move up very aggressively, and the other, price did respect it a little bit,
[29:22] respect it a little bit, but it was quite insignificant. zone, and then this was like a 15-minute flip zone. guys have learned in this lesson, flip zones are essentially the supply and
[29:37] demand zones that caused the opposing zone to fail. has overpowered the other, and that order flow has shifted. So, a supply flip zone forms when a demand zone has failed to create a
[29:52] higher high, and then price breaks below the reaction point and the last lower high. the last higher low, which is in somewhere around here.
[30:06] And a demand flip zone is formed when a supply zone fails to create a lower low, and then price breaks above the reaction point and the last lower high, causing the trend direction to shift from bearish to bullish.
[30:22] Okay? So, flip zones are they are not just failed reactions, they are about failed zones that led to a structural shift. They tell us that demand has overpowered supply or overpower or supply has overpowered demand, sellers
[30:36] versa. So, once again, this is just another tool in your arsenal to help you understand who is in control of price, whether the buyers or the sellers itself.
[30:50] combine this with all the other concepts that we are teaching here, right? This is just another confluence that you can add into your trading plan. And yeah, really just helped me read the market and just make everything a lot more
[31:05] So, with that being said, I hope you guys have enjoyed this lesson. And I'm next lesson. As always, remember you're just one trade away.



⚡ Saved you 0h 31m reading this? Transcribe any YouTube video for free — no signup needed.