
Why Price Moves: Supply vs Demand
60sExplains the core market mechanism in a simple, visual way that appeals to beginners.
▶ Play Clip"Delivers a solid, actionable guide on supply and demand trading, though the '2026 Guide' label is a bit of a stretch."
This video provides a comprehensive guide to trading supply and demand zones, covering their definition, how to identify and mark them on a chart, and two practical trading strategies. It emphasizes the importance of aggressive price moves and offers tips on entry, stop-loss placement, and using multiple time frames for confirmation.
Price moves up when demand exceeds supply (buyers accept higher prices) and down when supply exceeds demand (sellers accept lower prices). Volume footprint can visualize this imbalance.
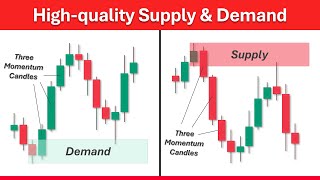
A demand zone is where buyers previously pushed price up; a supply zone is where sellers pushed price down. These zones act as potential support/resistance because markets 'remember' strong moves.
Look for three consecutive green (demand) or red (supply) candles with large bodies and strong push distance. This indicates aggressive trading, not slow sideways movement.
Mark the area where the move began. Common methods include marking the impulsive candle itself or the last opposite-colored candle before the move. The choice depends on which yields a more valid zone.
Wicks highlight strong price rejection. Marking the bottom of a wick (for demand) or top (for supply) can define a zone where price is likely to react again.
Price may not always reach the zone or may overshoot. To avoid missing trades, place entry orders a spread above the zone; to avoid stop-loss hunts, give more room or enter mid-zone.
Identify trend (e.g., 1-2-3 move, protected swing low), mark zones, place buy limit at demand zone with stop below swing low, target next key level. Check higher time frame for room to run.
Use a higher time frame for trend and zones, then drop to a lower time frame (e.g., 4H to 15M) for entry confirmation. Wait for price to reach the zone, then look for rejection signals like liquidity grabs.
A bearish liquidity grab occurs when price breaks above a high but closes back inside the range; a bullish grab is the opposite. These signal failed breakouts and often lead to strong moves.
Successful supply and demand trading requires patience, context, and risk management. By focusing on high-quality setups and avoiding forced trades, traders can make this approach a consistent part of their strategy.
What is the fundamental force that drives all price movement?
The balance between buyers and sellers (supply and demand).
00:44
What is a demand zone?
An area where buyers previously entered the market and pushed price higher.
01:39
What is a supply zone?
An area where sellers have entered the market and pushed price lower.
01:53
What three-candle pattern indicates a strong demand zone?
Three consecutive green momentum candles with large bodies and strong push distance.
02:48
What is the most important rule for marking supply and demand zones?
Focus on the area where the move began.
03:15
Why are wicks important in supply and demand trading?
They highlight areas of strong price rejection, where price is likely to react again.
04:56
How can you avoid missing trades when price taps the tip of a demand zone?
Place your entry a spread size above the start of the demand zone.
05:51
What is a bearish liquidity grab?
When price breaks above a previous high but quickly moves back inside the range, showing buyers failed.
11:47
What is a bullish liquidity grab?
When price breaks below a previous low but quickly returns inside the range, showing sellers failed.
12:15
What is the recommended time frame ratio for the two-time-frame strategy?
The entry time frame should be two times lower than the higher time frame (e.g., 4H to 15M).
10:07
Price Movement is Supply and Demand
Establishes the foundational principle that all price action is driven by the balance of buyers and sellers.
00:44Three Momentum Candles Rule
Provides an objective, actionable criterion for identifying strong zones, filtering out weak ones.
02:34No Guaranteed Rejections
Honest acknowledgment that zones are not perfect, with practical tips to mitigate missed trades and stop-loss hunts.
05:25Liquidity Grabs as Signals
Explains a specific, high-probability entry trigger that combines price action with liquidity concepts.
11:35[00:02] to talk about one of the most fundamental concepts in trading, supply and demand. We'll explain what they are, how they affect the price, how to mark them correctly on the chart, and the psychology behind why price reacts to
[00:15] By the end of this video, you'll know how to mark strong supply and demand zones, how to filter out weak ones, and how to trade them with higher accuracy. interested in, hit the like button to support the channel and subscribe if
[00:30] support the channel and subscribe if you're new.
[00:44] every price movement is driven by one simple force, the balance between buyers and sellers. When demand is higher than supply, price goes up because buyers are forced to accept higher prices. On the contrary, when supply is higher than
[00:59] demand, price goes down because sellers are forced to accept lower prices. Now, if we apply a volume footprint to the candles, we can see this process more clearly. The volume footprint shows how much buying and selling happened at each
[01:14] price level inside the candle. If buyers are more aggressive, we will see more traders were willing to buy at higher prices. If sellers are more aggressive,
[01:26] showing that traders were willing to sell at lower prices. In simple terms, price moves up when buyers are willing to pay higher prices and moves down when sellers are willing to accept lower
[01:39] prices. This is how all price movement happens in the market. Now what are the supply and demand zones on the chart? A demand zone is an area where buyers previously entered the market and pushed price higher.
[01:53] Similarly, a supply zone is an area where sellers have entered the market and pushed price lower. These zones are important because markets often remember where strong buying or selling occurred. When price returns to a supply zone,
[02:06] sellers may step in again, potentially causing price to move lower. When price revisits a demand zone, buyers may become active again, which can push the price higher. In simple terms, demand zones act like potential support and
[02:21] supply zones act like potential resistance. They help us identify areas on the chart where price is more likely to react rather than move randomly. But the key point here is that we want to look for aggressive buying and selling
[02:34] when identifying supply and demand, not slow sideways movement. impulsive price moves showing clear imbalance between buyers and sellers. To make things more objective, we need to
[02:48] see three green momentum candles to mark an area as a demand zone. Similarly, three consecutive red candles with large bodies and strong push distance would make a good supply zone. The reason is that we want to identify
[03:02] an area where traders previously showed interest rather than just small moves in the market. Now, how do we correctly mark the supply and demand zone range on the chart? While traders use different methods to
[03:15] mark these zones, the most important rule is to focus on the area where the move began. Marking the start of the move largely depends on the candle's formation. So, let's look at some common ways to mark these zones on the chart.
[03:30] Here, this is our latest impulsive move to the upside. This green candle represents the area that created this move. So, we mark it as the demand zone made during this candle. When price returns to this area, we expect a
[03:45] returns to this area, we expect a rejection somewhere inside this zone. Another common way is to mark the last red candle before the bullish move. This candle represents the last selling pressure in the market. We mark this
[03:58] area as a demand zone because once price breaks above supply, it turns into demand. When price returns to this area, we expect a reaction which may lead to a rejection or continuation to the upside.
[04:12] not matter which candle to choose because they are about the same area. However, in some cases, the candlestick formation defines which area is better to choose. For example, if we mark the
[04:25] first red candle as the beginning of the bearish move, we would end up with a very small zone, which is probably not a good way to identify supply. In this case, marking the last green candle gives us a more valid area.
[04:41] On the contrary, in other situations, the first red candle may provide a clearer and more reliable supply zone depending on how the move develops and how price reacts afterward. Another important concept is the wick. Here the
[04:56] the candle since it shows where price was rejected and the momentum move began. The move did not start from the first green candle nor the previous red candle. It started at the bottom of the wick which forms our demand zone. Wicks
[05:12] are important price action signals on the chart because they highlight areas where strong price rejection occurred. By marking these levels, we can often expect price to react again when it revisits the zone. With all that being
[05:25] said, here's a very important point. No matter how accurately you draw the supply and demand zone, getting rejected exactly from that zone is not guaranteed. Sometimes the market reverses before
[05:37] reaching the demand area, and other times it needs a deeper retracement. So, how do we avoid missing trades and stop-loss hunts? To reduce the chance of missing trades, you can place your entry a spread size above the start of the
[05:51] demand zone. This way, price can trigger your buy limit, even if it only taps the tip of the demand zone before rejecting. To avoid stop-loss hunts, you can give your stop a bit more room when dealing with a small demand zone. In the case of
[06:06] a larger demand zone, consider entering near the middle of the zone and placing your stop loss below it. Up to this point in the video, we've talked about what supply and demand zones are, the psychology behind them,
[06:21] chart. And now we're finally moving into the important part, how to actually trade them. But before we continue, if you're looking for a trusted prop firm with fast and reliable payouts, then you need to check out Funded Next.
[06:36] Funded Next is one of the pioneer prop firms that offers both futures accounts and CFDs all in one place, which gives traders a lot more flexibility. They provide a wide range of challenge accounts starting from $5,000 all the
[06:49] way up to $200,000. And they also offer instant funding options, meaning you can start trading without going through a challenge phase. And for the Smart Risk community, you can get an exclusive 7% discount plus a
[07:02] 120% account reward, which is only available through our link. So, if that's something you're interested in, check out the link in the description. In this part of the video, we're going to discuss two strategies for trading
[07:15] to discuss two strategies for trading supply and demand zones. The first setup uses a single time frame and the second one uses two. So let's begin with the first strategy, the single time frame supply and demand entry. This trading
[07:28] plan follows very simple steps. You can apply it on any time frame you prefer and in any market. Step one is to identify the market direction because we Here's a brief explanation of how to quickly identify it. When price forms a
[07:44] one two three move followed by a breakout, we have a trend. If price breaks above the most recent swing high again, that confirms trend continuation. As long as price stays above the latest protected swing low, the market remains
[07:58] in an uptrend and we stay bullish. If we get another breakout to the upside, we mark the lowest point that caused that breakout as the new swing low. Again, as long as price respects this low, we look for buying opportunities.
[08:13] However, if price breaks and closes below the protected low, we get a change of character. This means buyers failed to hold the structure and sellers are gaining control, indicating a potential reversal. After this, we can start
[08:28] looking for fresh supply zones and prepare for short trades. Step two is to identify supply and demand zones based on the rules we discussed earlier in the video. So, here the market direction is bullish and are
[08:41] looking for buy trades. So, simply mark the recent demand zone and place a buy limit at the beginning of the zone and set your stop loss below it. If the stop loss sits below the swing low, even better. This usually provides a safer
[08:56] stop placement. For take profit, you can target the next significant level ahead of price. But before making our trade final, there's one important thing to check. How much room does price have before reaching the next key level on
[09:11] the higher time frame? For example, in this case, imagine if we zoom out to the higher time frame and see that the price has plenty of room before hitting the next key level. So, entering the trade makes sense. On the other hand, imagine
[09:26] if the price has just tapped into a major higher time frame resistance level with the potential to reverse the market. In that situation, taking a buy trade would be risky. In such cases, it's often better to wait for
[09:39] confirmation or look for selling setups instead of forcing a long trade. So, that was our first strategy. Clean, simple, and effective using just one time frame. Now, let's take things a step further and look at strategy number
[09:53] two, where we combine two time frames for even better trade precision. In the higher time frame, we apply the same concepts discussed previously with only one difference. We zoom into a lower time frame to add confirmation and
[10:07] execute the trade. This strategy is not limited to any specific market or time frame. However, your entry time frame should be two times lower than your higher time frame. Here are three time frame combinations you can use depending
[10:20] on your trading style. For example, if your higher time frame is the 4hour chart, you would drop down to the 15minute chart to execute the trade. So, let me show you how it works. In the first step, identify the trend and mark
[10:35] potential supply and demand zones on the chart. Also, check the higher time frame price has before reaching the next important level in order to avoid entering a bad trade. Next, wait for price to retrace back into your trading
[10:50] zone. Never enter a trade before price clearly reaches our demand zone because the market often sweeps early entries and uses them as liquidity for the main move. Once price reaches the supply zone, we zoom into the lower time frame
[11:04] to look for confirmation and then enter the short trade. Here on the lower time frame, we have a clear uptrend which represents the correction leg of the higher time frame. What we want to see is that price begins to respect the
[11:18] supply zone. In other words, we need to see rejections from this area or any signal that the lower time frame uptrend is starting to reverse. your entry trigger for a short trade such as a long wick rejection, a trend
[11:35] line break, or even a change of character. However, in this case, we want to see a liquidity grab forming inside the supply zone. A bearish liquidity grab occurs when price breaks above a previous high but quickly moves
[11:47] back inside the range. This shows that buyers failed to create a new high and price is immediately pushed back into the range, indicating bearish momentum. Additionally, price has swept the liquidity resting above the swing high.
[12:02] And after such a move, we often expect a stronger move to the downside. Similarly, a bullish liquidity grab occurs when price breaks below a previous low but quickly returns back inside the range.
[12:15] This indicates that sellers failed to push price lower and the market immediately rejects the lower prices, signaling bullish momentum. In this case, price has taken out the liquidity below the swing low. And after this
[12:28] sweep, we usually expect price to make a larger move to the upside, especially when it occurs inside a demand zone. The bearish and bullish liquidity sweep occur inside higher time frame supply
[12:42] and demand zones. So, how do we enter the trade using this method? First, draw a line from the tip of the wick at the most recent swing. When price goes up, grabs liquidity, and closes back inside the range, that becomes our entry signal
[12:57] the range, that becomes our entry signal to go short. Simply enter the trade and place your stop loss above the swing high and target the next important level ahead of price. But always remember that patience and context are key. Focus on
[13:11] highquality setups, manage your risk properly, and avoid forcing trades. If you stick to these principles, supply and demand trading can become a powerful and consistent part of your strategy. So guys, that's it for this video. I hope
[13:24] you found it valuable. If you did, please smash the like button to support our channel and help us create more videos like this. See you in the next videos like this. See you in the next episode.
⚡ Saved you 0h 13m reading this? Transcribe any YouTube video for free — no signup needed.