
The Billionaire's Dilemma: How Big Players Sell
47sUses a relatable analogy to explain complex institutional trading, making the concept accessible and intriguing.
▶ Play Clip"Delivers a solid beginner's guide to Wyckoff, but includes a lengthy Telegram plug and some repetition."
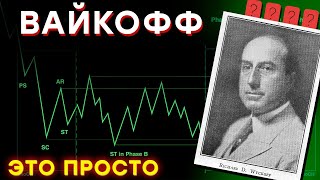
This video provides a beginner-friendly introduction to the Wyckoff method, a trading approach that focuses on understanding the actions of large institutional players. The presenter explains the core concepts of accumulation, distribution, and re-accumulation, emphasizing the importance of identifying market manipulation and confirming patterns through structure breaks. The goal is to help traders move beyond simple chart patterns and understand the underlying logic of price movements.
Traditional tools like trend lines often fail because large institutions do not use them. Instead, they focus on liquidity, which is the stops of ordinary traders. Understanding how large players execute trades gives a higher probability of trading in the right direction.
Create a reliable trading system and manage risk so that even with a majority of losing trades, you come out profitable at the end of the week and month. This mindset shift is crucial for thinking like someone who earns money, not just plays.
When large orders are executed, they leave traces on the chart. Wyckoff traders can see these traces and trade based on them. Example: a large shareholder must systematically sell higher and buy lower to avoid a sharp price drop, creating a sideways movement.
Ordinary traders see a sideways trend and simply buy or sell based on direction or trend continuation. Wyckoff traders analyze whether the consolidation is accumulation or distribution, which provides a more complete view of the market.
The Wyckoff method has been profitable for over 100 years, originally for stocks but now applicable to any market. Some elements, like vertical volume analysis, may not transfer directly, but the core logic remains.
Accumulation is the accumulation of an asset for further markup. Key elements: Selling Climax (SC), Automatic Rally (AR), Secondary Test (ST), and Spring. The scheme is confirmed by a breakdown of the bearish structure after manipulation of lows.
This scheme lacks a Spring and Selling Climax, starting with ST in Phase B and developing upward. The presenter rarely trades this scheme, preferring other tools.
Marked with a green square, the example shows a Selling Climax (SC) as the lower boundary, Automatic Rally (AR) as the upper boundary, manipulation of lows (Spring), and confirmation via structure breakdown before aggressive growth.
When removing liquidity (e.g., Spring), reduced volumes are desirable. When breaking the structure, increased volume is expected.
Wyckoff is used to determine future price direction, but entry points are found using other concepts. The presenter suggests watching another video on how to enter trades.
Re-accumulation is a repeated accumulation after an upward impulse. It is often confused with distribution. Key difference: look where liquidity is removed (from above or below) and wait for structure breakdown confirmation.
Distribution is the sale of assets, an inverted accumulation. Example on LTC chart: Preliminary Offer (PO), Buying Climax (BC), Automatic Reaction (AR), Secondary Test (ST), Sign of Weakness (SOW), and Upthrust (UT). Confirmation is a breakdown of the bullish structure.
Redistribution is a sideways movement in a bearish trend, followed by continuation downward. It is the opposite of re-accumulation, with manipulation of highs. Confusion with accumulation is common; look at liquidity removal direction and structure breakdown.
Be patient, do not constantly open trades. Enter only after confirmation (structure breakdown). Trying to catch the exact maximum often leads to being stopped out.
Practice by looking at charts from a year ago, identify patterns, pay attention to manipulation of highs and lows, and wait for confirmation. The more time devoted, the better results, after hundreds of hours of backtesting.
The Wyckoff method provides a logical framework for understanding market manipulation by large players. By learning to identify accumulation, distribution, and their variations, and by waiting for structure breakdown confirmations, traders can improve their probability of success. Practice and patience are essential to mastering this approach.
What is the main reason traditional technical analysis tools like trend lines often fail?
Large institutions do not use them; they focus on liquidity, which is the stops of ordinary traders.
00:14
What is the key advice for becoming a profitable trader?
Create a reliable trading system and manage risk so that even with a majority of losing trades, you come out profitable.
01:38
What are 'traces' in the context of Wyckoff?
Traces are the marks left on the chart when large orders are executed, which Wyckoff traders can see and trade based on.
02:18
What is the purpose of accumulation?
Accumulation is the accumulation of an asset for the purpose of further markup (price increase).
05:03
What are the key elements of accumulation scheme #1?
Selling Climax (SC), Automatic Rally (AR), Secondary Test (ST), and Spring.
05:03
How does accumulation scheme #2 differ from scheme #1?
Scheme #2 lacks a Spring and Selling Climax, starting with ST in Phase B.
05:46
What volume behavior is desirable when removing liquidity?
Reduced volumes are desirable when removing liquidity.
07:28
What is re-accumulation?
Re-accumulation is a repeated accumulation of an asset with the aim of further markup, often confused with distribution.
08:42
What is distribution?
Distribution is the sale of assets, an inverted accumulation.
11:36
What is the key confirmation for any Wyckoff scheme?
A breakdown of the structure (e.g., bearish structure for accumulation, bullish structure for distribution).
07:15
What is redistribution?
Redistribution is a sideways movement in a bearish trend, followed by continuation of the downward movement.
13:50
How can you distinguish re-accumulation from redistribution?
Look at where liquidity is removed (from above or below) and wait for structure breakdown confirmation.
14:33
Why Trend Lines Fail
Explains the core reason behind Wyckoff's effectiveness: large players ignore traditional tools and target liquidity.
00:14Traces of Big Money
Illustrates how large orders leave visible traces on charts, forming the basis of Wyckoff analysis.
02:18Wyckoff's 100-Year Proven Method
Highlights the historical reliability of the Wyckoff method across markets.
04:20Structure Breakdown as Confirmation
Emphasizes the critical rule that a scheme is only valid after a structure breakdown, preventing false signals.
07:15Patience and Confirmation
Stresses the importance of waiting for confirmation to avoid being stopped out, a common pitfall.
15:11[00:02] in this video we'll talk about the basic concepts of fact, everything is simpler than it might seem at first glance. The purpose of this video is to
[00:14] explain this method in simple terms. There wo n't be all the nuances here, but the basics that you'll learn now will give you the opportunity to trade effectively and successfully opportunity to trade effectively and successfully using the
[00:29] trend lines, or the like don't work in the market. At least while you're studying the Wyckoff method, get this out of your head because the market works a little more complicated. Most likely, you've noticed that the market often knocks you out on a stop and
[00:42] starts moving in the direction you need. Many call this manipulation. This happens because large institutions don't trade using these tools. No one sits in a bank and thinks about buying on a touch of the
[00:55] support price using classical technical analysis. A large player always has huge orders, and the liquidity is the stops of ordinary traders. Therefore, you must learn to understand how large players execute their trades.
[01:10] Then you will have a higher probability of trading in the right direction. I wouldn't call this word manipulation because it's the norm. This is how it works. The market in general, such a stereotype arose due to the fact that many people thought or
[01:24] still think that large players sit and deliberately do not allow them to earn money by manipulating the market back and forth. It is quite difficult to become a profitable trader with such pricing, especially in the absence of basic knowledge and experience, but I will give
[01:38] you advice. Create a reliable trading system and learn to manage risk so that even with the majority of losing trades you come out profitable at the end of the week and month. That is when you will begin to think like a person who has come to
[01:52] earn money and not just to play. Before you start, I recommend subscribing to my Telegram channel. This is my blog about trading in which I share my analytics and thoughts on the market, including using the concepts of Wi-Fi.
[02:05] Subscribe in it, you will find a lot of useful and interesting information for yourself as a trader. I left a link in the description. Now let's talk about big money and analyze how it moves. The main thing you need to understand is that it
[02:18] leaves traces on the chart when hundreds of millions of orders are executed, and we, that is, people who trade according to the Smart M concept and We can see these traces and trade based on them. I'll give a simple example so you
[02:32] understand what I mean when I talk about traces. Imagine that you are the owner of a large company and you have a lot of shares that you want to sell. Because you control a huge number of shares, you can't just
[02:45] take and sell them all at once in a short time simply because this will most likely lead to a sharp drop in the price of these shares. Therefore, instead of just selling, you need to think of a systematic way to do this:
[02:58] sell higher, buy lower, and so that the price moves sideways. When all your shares are sold, that is, distributed. Then give the market the opportunity to make the right move. It also works the other way around for
[03:11] purchases, that is, accumulation of assets. You should gradually buy lower, sell higher to hold the market in such a sideways movement. This way, the price will not change much. You accumulate or distribute in order to then allow a
[03:25] large price movement and make a profit. This is how it works. Traders trading on Wyckoff view consolidation completely differently than an ordinary trader who trades classical technical analysis. I do n't really know the strategies of such traders,
[03:39] but many do So, for example, the price rises and a sideways trend begins. If the price goes up, he will buy. If down, he will sell. The logic is simple, or the trader can reason that the exit from the sideways trend will be in the direction of the trend
[03:53] and will simply open a Long position. There are many such strategies and I'm not saying that they are all wrong. Sometimes you will get lucky. But this is in any case not a complete view of the market. The point is that if the trend has already begun, then the main
[04:07] positions are already open, and when the price goes into a sideways trend, you have two possible scenarios: the price reacts to someone or is distributed. Here you need to learn how to correctly analyze price behavior based on certain
[04:20] factors in order to determine further movement. At this stage, you use the Wife methodology, which has been proving its profitability for over 100 years. It was originally used for stock trading, but now it is applicable
[04:34] to any market. There are also elements that you may not transfer to your trading from the original source, for example, vertical volume analysis. But I still partially touched on this topic for better understanding. So, if you want to learn how to
[04:49] see where large players accumulate or distribute assets, then you first need to familiarize yourself with the basic schemes and understand them. logic Okay, let's start with the accumulation scheme in brief - this is the accumulation of an asset for the purpose of further
[05:03] markup. On the screen you see the accumulation scheme number one. To identify this scheme on a real chart, you need to pay attention to the manipulation of the lamas and the subsequent breakdown of the bearish structure. This happens because a large player
[05:17] collects stops of traders with langam in order to gain his huge position. You should pay attention only to key lows, this is SK selling climax and stain Face B. Many traders use these lows as support levels and
[05:31] open trades from them. Therefore, when such lows are updated, liquidity is released to fill the orders of a large operator to buy. This is why the price updates the lows and only then begins to grow. There is also a second
[05:46] accumulation scheme, which differs in that it does not have a springer minimum with a selling climax, this will be ST In Face B and then it begins to develop in an upward direction. I rarely trade this scheme. It is easier for me to use
[06:00] other tools for making decisions in such situations. Now let's see how Two examples are marked with a green square. Let 's start with the first example of accumulation with a
[06:16] looking for a selling climax where the price stopped and began to move in an upward direction. We mark this minimum as SK. This will be the lower boundary of our range. Next comes the automatic Ral. This is the movement after the
[06:30] selling climax in an upward direction, which forms the upper boundary of accumulation. Then we look at the key elements of manipulation. Lays are manipulated. The price updates the minimum, which is considered a support zone for poorly informed
[06:45] traders, thereby forming a stain. Face B returns back to the range. It is traded a little, liquidity is formed on both sides, and before starting the asset markup, the final collection of stops occurs. Spring, all liquidity is collected and
[07:01] aggressive growth begins. Remember the important point: the validity of any scheme is always confirmed by a breakdown of the structure. Only when you see that the price has updated the previous Low High, is this a confirmed accumulation scheme, and with a
[07:15] high probability, an asset markup will begin. To view the base on market structure and how to determine a structure breakdown, click on the video in the tips now a little Regarding volume analysis in these schemes, everything is very simple. You must
[07:28] remember that when removing liquidity, it is desirable to have reduced volumes, and when the structure is broken, increased volume. We move on to the second scheme without
[07:42] downward impulse. The same label will be used here for the climax of sales. Here, Ar, then will be used here for the climax of sales. Here, Ar, then Up Trust and stain Face B. The movement that collects liquidity for the climax of sales. As you can see in this example, there is no
[07:57] springar. This is normal. This may indicate that a large player has already gained his position or there are no sellers left and there is no need to make another downward movement. Next, we had confirmation of a breakdown of the structure, a return to the test and an active
[08:13] markup. I understand that now this may seem difficult, but don’t worry, this is temporary. All traders who want to trade on Wyckoff go through this. Just look at the key levels and practice. Over time, understanding will come.
[08:27] Trust the process. And another important point is that we use Wyckoff to determine the future direction of the price, but you will look for an entry point using other concepts. There are also several more interesting
[08:42] schemes left here that we will now consider, but first, you need to understand what a reaction is. Repeated accumulation of an asset with the aim of further markup. The reaction pattern is similar to distribution, and many traders cannot
[08:57] correctly determine the difference. As a result, short positions are opened, the market goes against them, and the trader again thinks that he is being manipulated. To prevent this from happening to you, you only need to stop trading based on pictures. Understand
[09:11] the logic. And all problems will be solved. Here, the price behavior will be similar to accumulation. We pay attention to the manipulation of lays and the breakdown of the structure as confirmation. Highs are often not updated during the reaction regarding
[09:25] lays. Here, we note the preliminary offer. The nation of purchases is looking for this movement, which forms the lower boundary of accumulation and collects local liquidity. Then there is an automatic rally, which can reach a climax of
[09:40] purchases and even go slightly above this maximum, and often traders begin to confuse the reaction with distribution. It is because of this that a spring should follow - the final withdrawal of liquidity before the markup and the breakdown of the
[09:54] structure. Try to be patient when you trade according to this concept. You need to open trades every minute. Try to find situations on charts that will be understandable to you and you will reasonably open your
[10:07] positions and Let's now move on to examples on the chart, we will not after the spring, this will be the culmination of purchases here Shake, followed by a price reaction and there was a pressure of liquidity
[10:23] higher, this will be AT Action In some cases, it may not be further we see manipulation of the lags here the price updates by several points this minimum this could potentially be a spring but you must understand that
[10:37] traders' stops are not only located immediately behind a break or high, therefore you should look at more significant movements that clearly go beyond key levels the price returned to the middle of accumulation and there was a final removal of liquidity spring
[10:51] further We have the last point of support and acceleration in asset prices Well, and you see the outcome yourself So what we have here is an accumulation in which there was a reaction after the spring combination for opening Long positions now we look at another
[11:08] example here the situation is completely similar to the first accumulation scheme the only difference is that this sideways movement begins to form after The key events of the upward impulse have already been noted. You need to pay
[11:21] attention to the fact that the price is being manipulated. Loya and after the spring siv growth, a breakdown of the structure is a confirmation of your analysis and a move even higher with accumulation and re- accumulation. We figured out this is the basics that
[11:36] learning how to trade on Wyckoff. Let's move on to distribution. This is distribution, that is, the sale of assets. Distribution is an inverted accumulation. The logic is absolutely the same. The market for
[12:01] will be confirmed by a breakdown of the bullish structure. An example of distribution will be the LTC chart. This is the very top of the previous upward trend. We note these movements in the same way. Here will be a preliminary offer. Here is a
[12:14] climax of purchases. An automatic reaction. Tariff test. Then follows a sign of weakness and manipulation of the highs. This will be a UT. And this is a UT now. Try
[12:27] to consider this situation not from the sides of the picture, but understand why this is happening. In this sideways movement, traders begin to short for various reasons. Therefore, above these lows, there are a large number of stops for purchase. In turn, a large player is
[12:41] always interested in selling at the highest prices, therefore, manipulation of the highs occurs in order to collect this Liquidity and then after the activation of the bulk of stops, the market begins to really fall, this works
[12:54] exactly the same way and the same as with accumulation, confirmation of the distribution will be a breakdown of the expect that the price will really move lower and lower and once again, I
[13:06] repeat, we do not use Vakovsky watch my video, which is now displayed in the tips, in it I
[13:21] tell you how to enter a trade correctly, so you can apply the information from these two videos together. If you now look at the higher timeframes, you can see a massive downward movement after the
[13:34] formed distribution that we just defined. Distribution also show this because it works. Similarly, with the second accumulation scheme, only in the other direction. Let's better move on to Redi Ribu. Redi Ribu is a
[13:50] redistribution of an asset, a sideways movement that comes from a bearish trend, followed by a continuation of the downward movement, and again, this is the opposite of a reaction, only here manipulation will occur. Hami, with
[14:05] this scheme, many traders also have big problems. Simply because they confuse Redi Sriblo, you At first, the situation on the chart will be indistinguishable. You will find preliminary support, a
[14:18] selling climax, an automatic rally, a secondary test, which in this example comes out slightly below SK, which may make you think that this is stain Face B and you will wait for a spring after which a higher movement will begin, but as I said
[14:33] earlier, to distinguish these patterns, you must look where liquidity is removed from above or below to give you additional confirmation that you are looking at redistribution or accumulation, and then wait for
[14:46] confirmation in the form of a breakdown of the structure and you can start looking for an entry into a position by analogy with the reaction to whom, only inverted, we see how the price manipulates we see how the price manipulates highs here. Here was a uta, and here is Utah, after
[14:59] which a downward movement followed that broke the bullish structure, then the last resistance point was formed and the movement lower continued. To successfully trade according to this concept, you should be
[15:11] patient, do not constantly break open trades. Let the market develop and enter only after confirmation, that is, a breakdown of the structure. If you try to catch The very maximum, then most likely you will often be knocked out by the footsteps. And
[15:26] if you have a situation where you can easily determine accumulations but cannot determine distribution, then use the chart settings use the chart settings simply
[15:45] Anyone can, you just need a little patience and experience. There were not all the nuances and some tricks here. There was no explanation of each movement, but for a start, this is enough. Perhaps in the distant future I will release another video on this topic,
[15:59] release another video on this topic, which will analyze
[16:21] distribution patterns on both weekly and second timeframes. Use the market structure with Wyckoff patterns for a more accurate and effective analysis. Do not trade based on the picture, but try to understand the logic of price movement.
[16:37] Practice. Try to cast the chart a year ago. Look for the patterns I showed in this video and learn to identify them. Pay attention to the manipulation of highs and lows. Also, wait for confirmation. This will be a breakdown of the structure, after which the pattern
[16:52] becomes valid. As more time you devote to this concept Your results will grow after hundreds of hours of K-testing behind you. The Vikon schemes are clear and easy to determine. Wherever you open the chart, you can
[17:07] see these schemes just everywhere, and that's it. I hope I helped you hope I helped you understand the concepts a little.
⚡ Saved you 0h 17m reading this? Transcribe any YouTube video for free — no signup needed.