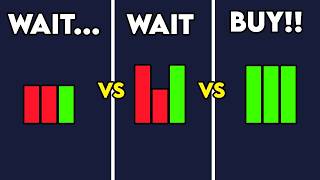

Market Manipulation Exposed
44sTaps into the universal fear of market manipulation and promises insider knowledge, making it highly shareable.
▶ Play Clip"Delivers on the promise of explaining volume, but the title oversells the 'doesn't work' angle; it's a solid tutorial with some sponsor filler."
The video explains how market manipulation by big players affects price action and why volume is a more reliable indicator. It provides a simple blueprint for reading volume, debunks common misconceptions, and offers a practical strategy for incorporating volume into trading.
Markets are manipulated daily by hedge funds and institutions to scare retail investors and use them as liquidity.
An ex-hedge fund manager admits to creating artificial activity to move prices, proving manipulation is real.
While price can be manipulated, volume is harder to fake, making it a valuable addition to any strategy.
Price is like the winning president (outcome), while volume is like the number of voters (conviction behind the move).
Healthy: big green candle with high volume. Red flag: small candle with high volume (absorption). Low volume with rising price indicates no supply.
Red volume does not mean selling; it just matches the candle color. Volume is the total transactions, not who's winning.
If price and volume rise together, it's a strong uptrend. Divergence (price up, volume down) signals weakness and potential reversal.
Price making higher highs but with decreasing volume shows weakness, predicting a fall. Similarly, lower lows with decreasing volume signal seller exhaustion and a possible bottom.
Add the volume indicator, zoom out, analyze volume trends and spikes, then apply to your strategy (e.g., supply/demand zones).
Volume is a powerful tool to confirm price moves and spot manipulation. By focusing on volume size and divergence, traders can improve their predictions and avoid false signals.
What is the main reason price can be manipulated?
Big players can artificially drive price up or down to scare retail investors and use them as liquidity.
00:16
What does volume represent in trading?
Volume shows the amount of conviction or money behind a price move.
02:14
What does a small candle with high volume indicate?
It indicates that large amounts of money are being absorbed by a large seller, often leading to a price drop.
03:48
Is red volume a sign of selling?
No, the color of the volume bar just matches the candle color and has nothing to do with who is buying or selling.
05:24
What does a divergence between price and volume signal?
If price goes up but volume goes down, it signals weakness and a potential reversal.
06:15
What is the 'healthy' volume scenario?
A big green candle with high volume, showing strong support and conviction.
03:34
Market Manipulation is Real
Provides a concrete claim that markets are manipulated, setting the stage for the video's core argument.
00:16Election Analogy for Volume
A memorable analogy that simplifies the concept of volume as conviction.
02:14Debunking Volume Color Myth
Corrects a common misconception that red volume means selling, which is crucial for accurate analysis.
04:57Volume Divergence Strategy
Provides a practical, actionable rule for predicting reversals based on volume divergence.
06:15[00:02] price, but they can't manipulate volume not easily. Volume feed is very useful. You can actually tell from price and volume relationships whether somebody's >> Let's get straight to the point. The markets are constantly manipulated
[00:16] against you. Every single day the market is manipulated in some type of fashion by big hedge funds, institutions, and big money who can artificially drive the price up and artificially drive the price down. And it's meant to do just
[00:29] one thing, to take advantage of the average retail investor like you and me, scare us out of our positions, and use us as liquidity. I even posted a guide on how to spot this manipulation in my Telegram, which is absolutely free to
[00:44] join. To prove my point even more, here's an interview with an ex-hedge fund manager, Jim Cramer. I know, Jim Cramer. He kind of has a reputation, but everything he is saying in this interview is actually
[00:56] happening on a day-to-day basis in the markets. You know, a lot of times when I was short at my hedge fund and I was positioned create a a level of activity beforehand that
[01:09] much money. I don't maybe commit 5 million in capital to do it and I could affect it. You can move it up and then fade it. That's all often creates a very negative feel. That's a strategy very worth doing. I would encourage anyone
[01:22] because it's legal and it very satisfying. Your sole strategy just uses price action and price action alone. I can
[01:34] guarantee you that strategy will not work in the long run because this manipulation tactic they use will falsely exit you out of your positions. But, here's the good news. While yes, the big players can easily manipulate
[01:47] price, they can't so easily manipulate volume, which is exactly why we need to add it to our current strategy. You see, when talking about charts, you can look at two things. Price, did it go up, down, or sideways? But price is limited
[02:00] because it just shows you the outcome of what happened. And as we proved before, that outcome can be manipulated. The second way of looking at a chart is by looking at the volume. Volume shows you how much conviction was actually behind
[02:14] participated, how much money was injected into the market to make that move happen. You can almost think of it like an election. Price is the equivalent of the president who won. So again, you were just seeing the outcome.
[02:27] But volume shows you the amount of voters each side had. For example, say if we just had two people vote for the next president, your Uncle George and your Aunt Boniqua. The result wouldn't really mean anything. Two people voting
[02:41] is not enough people to get a good consensus on who's going to win the next million people show up and vote, well, now that's a different story. It's the same thing with trading. If you have a big green candle with low volume, that's
[02:56] pretty suspicious. If you have a big green candle with high amounts of volume, that's conviction. So you shouldn't be asking where did price go, you should be asking how much money did it take for price to get to that point.
[03:09] Now, I know when first using the volume indicator, it can be super confusing. You don't really know what to look for. Should you be buying when it's green, selling when it's red, big, small, what do I do? To help you out with this, I
[03:22] have a simple blueprint to simplify everything. There are only three scenarios that you really need to know. The first scenario is the healthy scenario, which is what you want to see. In this scenario, you have a big green
[03:34] candle with high volume, showing large amounts of money is supporting this move. Lots of money coming in and the chart agrees with that. This is exactly what you want to see. But that all changes if this scenario happens. If you
[03:48] have a small candle with large amounts of volume, this is a huge red flag. You see, whenever you have a small candle with large amounts of volume, that is showing large amounts of money is coming into the market, but the price isn't
[04:02] moving, which means the money is being absorbed. The buyers are pushing hard, but there's an invisible wall, or in other words, a large seller absorbing the buyers. So, here there's a small candle, but if we look at the volume,
[04:16] there was a ton of volume, showing the buyers are being absorbed by a big seller. And look what happens, price falls shortly after. Okay, so both of the previous examples, the volume was high. But what happens if the volume is
[04:30] low? Well, if the volume is low, showing there isn't a lot of activity, yet the chart is still going up, this just shows there's no supply, or in other words, the sellers are absent and there's no friction against the buyers. So, the
[04:43] buyers can push up the price easily because there's no competition. Now, I know what some of you are thinking. What if the volume bar is red? Or what if the answer that question, let's do an episode of MythBusters!
[04:57] Which trading law? A super common misconception about volume is green volume means buying and red volume means selling, which is completely not true. You see, every trade requires a buyer and a seller. So, if you bought 69
[05:10] shares, that means someone out there sold you 69 shares. For every buyer, there's a seller, no exception. Volume is simply the amount of transactions that took place, not who's winning. So, a common misconception that I see the
[05:24] majority of traders make is they see a red volume bar and they instantly think there is more selling activity, which is not always the case. The color of the volume bar is simply just matching the color of the candle above it. So, if we
[05:37] go to our chart, you can see we have a red candle. And if we look directly have another red candle, we have another red volume bar. We have a green candle, we have a green volume bar. The point I'm trying to get in your head, the
[05:50] color of the volume bar has nothing to do with who is buying and who is selling. It just shows if price closed above or below from where it opened. So, in reality, for the most part, the color of the volume bar is pretty irrelevant.
[06:03] All we care about is the size of the volume bar. So, putting all of this together, we can make a pretty good strategy for predicting what price is about to do based on the volume. If price is going up and the volume is
[06:15] going up, that is showing a strong uptrend. If price is going down and the volume is going down, that is showing the sellers are getting weaker. That's pretty obvious. But, when they start moving opposite of each other, that's
[06:28] when the true signals start revealing themselves. And the best part is, this strategy isn't just for one market. The volume concept works for every market out there. Crypto, stocks, gold, whatever. Volume is in every market. And
[06:41] if you trade multiple markets, it doesn't really make sense to have five different brokers for each asset class. Why not just have one broker where you can trade everything all in one place. Introducing
[06:58] indices, all in one place. No KYC, no annoying sign-up fees, just pure easy trading. When they first came to me and asked to sponsor one of my videos, I said I would only do it if they gave my viewers a good deal because I'm a man of
[07:13] the people. And oh boy, did I get you guys a good deal. If you use the link in my description, the first 100 people that sign up with my link will instantly that sign up with my link will instantly get a 20% deposit bonus up to $750.
[07:26] So, if you deposit, say, $1,000, you will instantly get $200 for absolutely free that you can use instantly to trade for a while now and I got to say, they do a great job and make everything
[07:42] user-friendly. Go check it out and get that deposit bonus. Okay, back to the video. See, if we look at this chart, price is moving upwards. We're making higher highs and higher lows. So, if you are a price action trader and looking at
[07:56] price action and price action alone, you'd be sitting there thinking this is a very strong uptrend. But the moment we look at the volume, it tells us a completely different story. Even though the price is going up, the volume is
[08:10] getting weaker. With every new high that price is making, there's less and less transactions happening and the volume is getting smaller, which shows weakness. With this weakness, you could easily predict the price is about to fall
[08:24] because of the lack of volume, which is exactly what happens. The same exact If we have a strong downtrend, price making lower lows and lower highs, but we look at the volume and the volume is
[08:37] getting weaker as well, this is showing the sellers are getting exhausted. Each drop in price has less and less transactions, which means the selling is getting weaker, which often signals a bottom is forming, which again is
[08:50] exactly what happens. So, to combine everything that we just learned into your current strategy, all you have to do is follow these simple steps. First, it, I'll leave a link in my description.
[09:03] frame like the daily. Go to the indicators tab, search volume, click this default one. Before you even look at the price action, look at the volume first. Zoom out on your chart and simply just look at what the volume is doing.
[09:17] Is the volume increasing? Is the volume decreasing? Are there any unusual volume spikes? Once you answer those questions, next is when you actually apply it to your strategy. Say if you are using supply and demand. I've made multiple
[09:31] so if you want a more in-depth explanation on that, you can watch those like you were 5 years old, it's basically just the start of a strong uptrend or the start of a strong downtrend. You can almost think of it as
[09:47] support and resistance. In my opinion, supply and demand is more accurate, but simply. Mark your areas of supply and demand on the chart. If price comes up to your area of supply, or in other words, a resistance, then prints a small
[10:01] candle with large amounts of volume, this is showing the sellers are absorbing the buyers, which also means your supply zone is likely very strong. But, if price has a big green candle breaking your area of supply with large
[10:16] amounts of volume, this instantly shows you that supply level is likely very weak. Volume can be a little confusing, and I know this from experience. So, to help simplify this process, I made a volume checklist. I just posted it in my
[10:30] Telegram, which is completely free to join. Just click the Telegram link in my description, and you can check out the checklist. I did this purely just to help you guys out. You don't need to buy a $5,000 course like some of these other
[10:42] helps, and hopefully, you learn something from this video. Thanks for watching, and I'll see you guys next time.
⚡ Saved you 0h 10m reading this? Transcribe any YouTube video for free — no signup needed.



![BEST MACD Trading Strategy [86% Win Rate]](https://img.youtube.com/vi/rf_EQvubKlk/mqdefault.jpg)