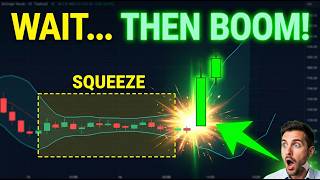

The Bollinger Band Squeeze Explained
60sClear, visual explanation of a key trading concept that educates viewers quickly.
▶ Play Clip"The title promises a powerful strategy and the video delivers exactly that, with clear rules and honest examples."
This video presents a simple yet powerful trading strategy for Pocket Option using only Bollinger Bands on a 5-minute chart. The core concept is the 'squeeze'—a period of low volatility where the bands contract, signaling an impending breakout. The strategy emphasizes patience, waiting for a proper squeeze and a confirmed close outside the band before entering a trade.
The strategy uses only Bollinger Bands with period 20 and deviation 2 on a 5-minute chart, with a 5-minute expiry. No other indicators are needed.
The squeeze occurs when the upper and lower bands contract tightly, indicating low volatility and building energy for a big move.
The squeeze must last at least 5-8 candles to be reliable. Shorter squeezes (2-3 candles) often lead to fake breakouts.
Enter only when a strong candle breaks and closes outside the band. A close above the upper band is a buy signal; a close below the lower band is a sell signal.
A live example shows a winning sell trade after a proper squeeze and a strong red candle closing below the lower band.
A live example shows a losing trade where the breakout candle looked strong, but the squeeze was not tight or long enough, leading to a reversal.
Another live example shows a winning sell trade with a proper squeeze, leading to a strong downward move and a profitable trade.
What are the recommended Bollinger Bands settings for this strategy?
Period 20, deviation 2 (default settings).
00:58
How long should the Bollinger Bands squeeze last before trusting a breakout?
The squeeze must last at least 5 to 8 candles.
02:06
What is the confirmation signal for entering a trade?
A strong candle that breaks and closes outside the band.
03:00
What do closes above the upper band and below the lower band indicate?
A close above the upper band is a buy signal; a close below the lower band is a sell signal.
03:14
Why do short squeezes (2-3 candles) often result in fake breakouts?
A short squeeze doesn't build enough energy, leading to fake breakouts that reverse.
02:32
What was the reason for the losing trade in the video?
The squeeze was not tight or long enough; the bands were still wide when price broke out.
07:21
The Squeeze as a Volatility Signal
Explains how the Bollinger Bands squeeze indicates low volatility and an impending big move, a core concept for the strategy.
01:38Patience Is the Edge
Emphasizes that waiting for a 5-8 candle squeeze is crucial to avoid fake breakouts, a key discipline for traders.
02:06Close Outside the Band as Confirmation
Defines the precise entry signal—a candle closing outside the band—which is actionable and clear.
03:00Losses Are Part of Trading
Honestly acknowledges that even good setups can lose, and highlights the importance of the squeeze quality, a realistic perspective.
07:21[00:01] "Hey, something big is about to happen." before it actually happened? No guessing, no random entries, just a clear visual signal that a major move is loading. Hey traders, welcome back to Sam Trading Strategies. And today I'm
[00:15] sharing one of the most powerful setups I use on Pocket Option. It's called the once you understand it, you'll never again. This is a 5-minute chart strategy, 5-minute expiry, one indicator
[00:29] only. Bollinger Bands. That's it. No overloading the chart, no confusion. But here's the thing, this strategy requires patience. And I'm going to show you exactly why that patience is what makes it work. Quick
[00:44] disclaimer before we start. Trading involves real financial risk. Results shown in this video are not a guarantee of your results. This video is for educational purposes only, not financial advice. Always practice on demo first
[00:58] and never trade with money you cannot afford to lose. Now, let's get into it. Before anything, let me show you the exact setting. Bollinger Bands, period exact setting. Bollinger Bands, period 20, deviation two. That's it. Default
[01:10] setting, nothing changed. Apply it on your 5-minute chart. One indicator, clean chart. Let's go. Okay, so first things first, let me show you what the Bollinger Bands actually look like on this chart. You've got three lines. The
[01:24] middle line is the 20-period moving average. The upper band and the lower band move based on how volatile the market is. Now, normally, these bands are wide. Price has room to breathe, room to move. But sometimes, something
[01:38] interesting happens. Look at the section right here. The upper band and the lower together. Almost like the market is taking a deep breath, pulling inward, getting very, very tight. This is called the squeeze, and it tells you one thing,
[01:53] low volatility is building up and a big move is coming. The is literally loading energy like a compressed spring. Most traders see a quiet market and think nothing is happening. But we see the squeeze and we think
[02:06] something is about to explode. Now, here is the most important rule of part. The squeeze must last at least five to eight candles before you trust the breakout. I know, I know, sitting and
[02:18] waiting is not easy. You're watching the chart, the bands are tight, you want to completely. But here's what I've seen over and over When the squeeze is only two or three candles,
[02:32] fake breakout. Price breaks out, pulls you in, then immediately reverses. Your A short squeeze doesn't build enough energy. It's like trying to launch a rocket on half fuel. It goes up and comes right back down. But a squeeze of
[02:47] five, six, seven, eight candles, that's real compression, real build-up. When that finally breaks, it moves with power and momentum behind it. So, count your candles. Be patient. That waiting period is your edge. You
[03:00] You're not entering when price just touches the band. You're not entering mid-candle while it's still forming. You wait for a strong candle that breaks and closes outside the band. That close is your confirmation. That's your signal.
[03:14] Look at this setup. After a solid squeeze, a strong candle breaks above the upper band and closes outside it. That's a buy signal. Bulls won the squeeze. Enter a buy trade, 5-minute expiry. And here, after the squeeze, a
[03:28] strong red candle breaks below the lower band and closes outside it. That's a sell signal. Bears broke through. Enter a sell trade, 5-minute expiry. Same strategy, same rules, two directions, simple. And
[03:42] before I show you the live results, I've made a free PDF guide with the exact rules laid out step-by-step. Grab it from the description below. Keep it open difference. Now, let me show you the real setups on the chart. I'll point out
[03:55] exactly where I entered, where I would skip, and the one detail that separates a real breakout from a fake one. Watch closely. Okay, traders. Now, this is where everything we just learned comes together on a real live chart. Look at
[04:08] this setup right here. Bollinger Bands applied, 5-minute candles, clean chart. Now, watch the right side of this chart carefully. See this massive red candle? Look how powerfully it dropped. It broke straight through the lower Bollinger
[04:21] Band and closed outside it. Strong candle, strong close, strong signal. bands in the middle section of the chart. They were squeezing, tightening,
[04:33] candles. That compression finally exploded downward. Bears took complete control, and the moment that candle closed outside the lower band, I didn't wait. I didn't second-guess. Sell trade entered, 5-minute expiry. This is
[04:48] exactly the signal we talked about. The squeeze built the energy, the candle confirmed the direction. That's all I needed. Now, the trade is live, timer is running, and look at the price. After that breakout candle, price did not come
[05:01] back up. It did not reverse. It kept moving in our direction, down. That big red candle on the right, that's the breakout candle we entered on, and price respected it completely. Now, this is the moment most traders struggle with.
[05:16] The trade is open, the timer is running, you start watching every second, every tick. Your heart is beating faster, but this is exactly where discipline matters. You made your decision based on the setup. You followed the rules. Now,
[05:30] you trust the trade and let it run. No panic, no closing early. Let the strategy work. And there it is, win. Trade closed. And now we do what this strategy is all about. We wait. The next perfect setup is coming. We just have to
[05:44] be ready for it. Okay. Now, let me show you another live setup, and this one I want you to watch very carefully because this is where trading gets real. Look at this chart. Bollinger Bands applied, 5-minute candles. See the right side. A
[05:59] upper Bollinger band and closes outside it. Powerful candle, clear breakout above the band. And looking at the bands before this, they had been widening after a period of tightening. The breakout candle looks strong. It looked
[06:13] convincing. So, I followed the signal, buy trade entered, 5-minute expiry. Setup looked clean, entry looked right. Let's see what happened next. Trade is live, timer running. And now, look at what price is doing after that strong
[06:28] breakout candle that went above the upper band. A red candle started forming right after it. Price began pulling back, coming back down. And I'll be honest with you, at this moment, watching that red candle form, I
[06:41] already had a feeling. The momentum that pushed price above the band did not continue. Instead of holding above, price started reversing back inside the bands. This is the uncomfortable part of trading. You
[06:53] followed the rules, you entered correctly, but the market sometimes has other plans. This is why we never risk money we cannot afford to lose. No matter how good a setup looks, the market always has the final word. And
[07:07] market always has the final word. And there it is. Trade closed, loss. Price reversed completely. The breakout did not hold. The trade closed at zero. Losses are part of trading. Every single trader loses. The difference is how you
[07:21] respond to it. Looking back at this setup, the breakout candle was there, but the squeeze before it was not tight or long enough compared to the ideal setup. The bands were still wide when price broke out. That reduced the
[07:33] reliability of this signal, and that is the lesson here. A good-looking candle The squeeze quality before the breakout matters just as much. This loss is a reminder. Stick to the rules strictly. Be selective. Not every breakout is
[07:48] worth entering. Only the ones with a proper squeeze behind them. Trade closed. And now we do what this strategy is all about. We wait. The next perfect setup is coming. We just have to be ready for it. Okay traders, look at this
[08:01] chart carefully. Bollinger bands applied. 5-minute candles. Clean setup. chart first. See how the bands were gradually tightening. Price moving sideways. Candles getting smaller. Volatility dropping quietly. The squeeze
[08:17] was building. And then right side of the chart one powerful red candle breaks straight through the lower Bollinger band and closes outside it. Strong momentum. Strong direction. No hesitation from the market. Bears
[08:33] That breakout candle told me everything I needed to know. Sell trade entered. 5-minute expiry. Now look at this. Trade is live and the market is moving. After that first breakout candle, price
[08:47] didn't slow down. It didn't reverse. It kept going. Another massive red candle formed, pushing price even further below the That is the power of a proper squeeze breakout. When the compression is real,
[09:01] the move that follows is real, too. Price is not just drifting down. It is dropping with full momentum behind it. Timer is running. Almost at expiry. And every second that passes, price is sitting exactly where we want it. Below
[09:15] our entry. Deep in profit territory. And there it is. Win. Trade closed. Green. Squeeze was right. Breakout was clean. Trade did exactly what the setup promised. This is the strategy working as it should. No panic. No guessing.
[09:32] Just rules followed correctly. If this video helped you, smash that like button and subscribe so you never miss a real trade breakdown like this. Stay patient, stay disciplined. See you in the next one.




⚡ Saved you 0h 09m reading this? Transcribe any YouTube video for free — no signup needed.