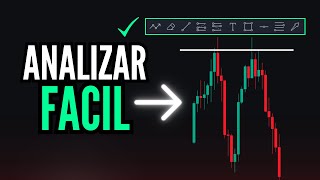

Stop Losing Trades: Start Here
45sDirectly addresses a common painful experience (losing trades) and promises a solution, hooking viewers immediately.
▶ Play Clip"The title promises three steps, and the video delivers a structured approach, though the steps are not explicitly numbered."
This video provides a step-by-step guide for traders to analyze charts effectively, focusing on using entry patterns and a single methodology to avoid confusion and improve trade accuracy.
The video addresses traders who feel blank when opening charts and promises to teach a step-by-step method for analysis and profitable trades.
Before analyzing charts, traders should have their tools ready, such as trend lines, horizontal lines, and annotation tools on platforms like TradingView.
Traders must select one methodology (e.g., indicators, technical analysis, Smart Money concepts) and avoid mixing them to prevent poor results.
Select a timeframe based on trading style (e.g., 5-minute for scalping/day trading) and analyze the current zone using recent support/resistance levels.
Mark highs and lows (support/resistance) and use entry patterns—recurring chart patterns—to identify trade opportunities.
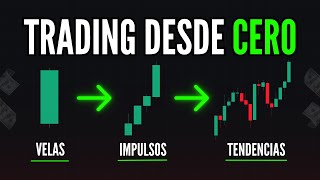
Use the three pillars of trading (uptrends, downtrends, sideways) to determine trend direction and structural changes.
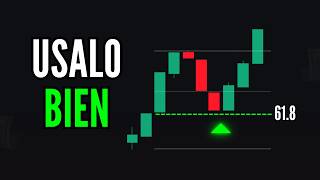
Entry patterns like retests or Fibonacci Golden Zone (50%-61.8%) confirm trades. Avoid pending orders; watch how price reaches levels.
If no entry pattern is present, increase timeframe or switch assets to find better conditions.
Mixing methodologies (e.g., support/resistance with order blocks) causes confusion. Stick to one and perfect its entry models.
Using entry models simplifies analysis and leads to precise trades. Avoid overcomplicating with many lines or indicators.
The key to successful trading is to choose one methodology, master its entry patterns, and apply them consistently without mixing approaches.
What is the first step before analyzing charts according to the video?
Prepare your tools (e.g., trend line, horizontal line) on TradingView.
00:25
Why should traders avoid mixing methodologies?
Mixing methodologies causes confusion and poor results because each has different parameters.
01:18
What timeframe does the presenter use for scalping and day trading?
The 5-minute timeframe.
02:23
What are the three basic pillars of trading mentioned?
Uptrends, downtrends, and sideways trends.
04:12
What is the Fibonacci Golden Zone range?
Between 50% and 61.8% retracement.
06:31
What should you do if no entry pattern is present on the chart?
Increase the timeframe or switch to another asset with better conditions.
08:50
What is an entry pattern?
A recurring chart pattern that signals a trade opportunity.
05:09
How does the presenter confirm a trade after a structural change?
By waiting for a pullback to the Fibonacci Golden Zone (50%-61.8%).
06:31
Choose One Methodology
Mixing methodologies is a common mistake that leads to poor trading results.
01:18Entry Patterns Simplify Trading
Using entry patterns is presented as the easiest way to trade, reducing complexity.
05:09Avoid Mixing Parameters
Support/resistance and order blocks have different parameters; mixing them causes confusion.
11:01Simplicity Leads to Precision
Using entry models avoids overcomplicating charts and leads to more precise trades.
14:01[00:01] completely blank, unsure of the next steps, then this video is for you. I'm sure you've experienced this: you're about to make the trade of a lifetime, only to have it
[00:13] go completely against you. If you've ever felt that way, then stay until the end of this video and don't miss a single detail. Today, traders, we're in a new trading class, and in this class, I'm going
[00:25] to teach you step-by-step what you need to do when you open your charts to start analyzing them and make perfect trades. I'll also first thing you need to do, regardless of whether you trade forex,
[00:38] binary options, or cryptocurrencies, is to have the tools you'll use ready before analyzing your charts. As you can see here at the top, I need for a simpler and more effective analysis. If you don't have
[00:52] everything organized, it will be a bit more difficult to you use TradingView, you can select each of the tools you need for your analysis from the left. Remember, there are many
[01:05] different ways to do this. But for example, I have the trend line and the horizontal line marked in my favorites. I also have the path and the brush marked so I can make all the annotations on my chart
[01:18] effectively. So make sure you always have them at hand. Then, traders, what we have to do before we start trading and analyzing our charts is identify which methodology we are going to use. Remember that nowadays in
[01:31] trading there are different methodologies to understand the same chart, and one of the mistakes traders make is that they tend to mix one methodology with another, and this unfortunately causes them to have
[01:44] bad results and for the trades to not be profitable. For example, if you use indicators, well, this is the moment when you have to start marking your indicators. If you use technical analysis, traditional analysis, or
[01:56] Smart Money concepts, before you start analyzing you have to know exactly which of the methodologies you are going to use to analyze your charts. Once we have selected it, in my case, I use traditional analysis:
[02:09] support, resistance, chart patterns, graphical tools, moving averages, Fibonacci, which are quite simple to use and super effective graphical tools. When we open our chart, we also have to know what
[02:23] timeframe it is on. We're going to operate depending on your trading style. In my case, I use a mix of scalping and day trading, but most of my trades are on short timeframes. That's why I use
[02:36] the 5-minute timeframe. Once we open our chart, we have to identify the correct zone to analyze. Many traders make the mistake of marking support and resistance levels from two days ago when their chart is
[02:50] completely away from that zone. So, the first thing we traders have to do is identify the chart in terms of zones. That is, here I have one zone, here I have another zone. And if you're going to trade this current zone on the
[03:03] chart, then you're going to analyze it starting from a previous zone. This is so that the support and resistance levels you mark are the most appropriate for your Perfect. So, what's the first thing we traders do? Very simple. First, we're going
[03:18] to mark our extremes. We're going to mark our highs and lows on the chart, our support and resistance levels. There you have it, traders, in a very simple way. And this support and this resistance are in the last
[03:32] zone of our chart. And from there, we're going to start using our entry patterns. Remember that if you want to open an account with the broker I'm using for forex, metals, or cryptocurrencies, you'll
[03:44] find the registration link in this video's description so you can trade on MetaTrader 5. Also in the description, you'll find all the details for my private trading academy. Okay, so once we've identified our
[03:56] support and resistance, it's time to start identifying the chart's direction. In another video, I mentioned that you can use the three basic pillars of trading: uptrends, downtrends,
[04:12] will help you identify when you have a trend, when a trend breaks, or when you have a structural change. From this point on, we start marking impulse, retracement, impulse, retracement, impulse, retracement, impulse, retracement,
[04:26] retracement, impulse, retracement, impulse, retracement, impulse, retracement, impulse that surpasses the previous one. Perfect. So, that tells us that this trend we had has ended because a trend ends when an
[04:40] impulse is no longer greater than the previous one and when a move surpasses our last low. And then, once you identify the part of the chart you're going to trade, the chart's direction, that's where
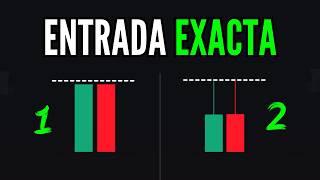
[04:56] strategies come in. I don't directly use a strategy as such; I've mentioned that the way In my opinion, the easiest way to trade is to use entry patterns. Entry patterns are figures or
[05:09] patterns that we can identify and that we already know the chart has repeated. For example, an upward trend tells us that if the retracements reach the 61.8% Fibonacci retracement level, then we're going to
[05:25] follow this same pattern. This is my entry pattern: when I open a chart, if my chart has a structure similar to the pattern or entry pattern, then I'm going to trade following this entry pattern. The topic
[05:39] of confirmations and strategies is a little different, but in my opinion, knowing the entry patterns or models is the easiest way to do it. So, what do we see here on the chart? I would recommend that you have at least
[05:52] three or four entry patterns that work for you most of the time. For example, most of my trades tend to be with changes in structure, for example, in an upward trend, when a move is
[06:06] no longer larger than the previous one, it breaks our last low. I would even recommend that you take a picture of these entry patterns. I've also shared images of entry patterns directly on my social media.
[06:18] So, once you We have this trend reversal or this structural change; we just need to wait for a pullback to confirm our trade. You can use basic breakouts, or you can also confirm with a
[06:31] Fibonacci retracement if this breakout or pullback is in the Golden Zone between 50% and 61.8%. Then you have perfect confirmation for a good trade. So we can see that
[06:46] on the left side we have a situation similar to our entry model, and we remove the lines, as I mentioned, always have your tools at hand. Perfect. We mark a line at our last perfect low, and then we see
[07:01] that the structure our chart is showing is quite similar to that of our entry model. Perhaps to confirm, you can mark a Fibonacci retracement and say, "Look, it's perfectly coinciding with the Fibonacci Golden Zone.
[07:15] This last low I have here is reaching the 50% Fibonacci level, which is the same as what my entry model tells me." So that's enough confirmation for you to wait for your trade. You just
[07:29] wait for the pullback, as it's happening right now, and from there, that's where you're going to place your trade. Use previous Fibonacci values to place your stop loss in the case of
[07:42] binary options, a 5 or 7 minute trade, or you can use the same analytical idea: know a pattern, an entry model, and look for a chart that has the conditions. Now, I don't really recommend leaving trades pending
[07:56] because you can't see how the chart moves, and for me, or at least for most of my trades, it's very important to be aware of how the chart reaches our Fibonacci support and resistance lines,
[08:10] order blocks, because the way it reaches them, or the confirmation we get, can make the total difference between success and failure. So, if you look closely, the analysis we do isn't
[08:24] complex at all; we simply have, as I mentioned, entry models, situations, or patterns that we already know the chart repeats over and over again. When we open a chart, we try to identify these entry models or something very
[08:38] similar to our entry models. But what happens if, for example, I open a chart that isn't following any of these situations, that is, it's not following any entry model? Well, the ideal thing would be to
[08:50] increase the stop loss a little bit. timeframe or simply change assets and look for another asset with better conditions. So let's take another example, traders. Okay, here we are with the euro and the dollar, and
[09:03] we're going to do exactly the same thing. Obviously, there are some charts where at first glance it's a little harder to identify what you're seeing, but it's very simple. In fact, if you look here at the top, we have one of the
[09:15] entry patterns that I've already shown you, which is the retest. So if I had opened this chart a few hours earlier, I might have been able to identify the retest entry pattern, and that would have saved me
[09:29] a lot of time marking indicators or lines that I don't even care about in the slightest. So, traders, let's begin. What do we do again? We're going to identify our chart in zones. Okay, if I'm going to trade
[09:42] this zone here, then we're going to mark the nearest zone that will be useful for our analysis. Perfect. If you want, you can increase the timeframe a little more to see which zone or part of the chart you're in,
[09:55] but what I would do is very simple: I arrive and set myself to the timeframe closest to what I'm going to trade. Perfect. I'm marking my extremes. Okay. My important extremes aren't just support and resistance levels,
[10:08] but significant lines. We're marking our upper line. Perfect. Our resistance. At the bottom, we're marking our support. Good. And what are we going to do now? Well, we see that we have a
[10:21] completely downward move here that hasn't had a very deep retracement. Perfect. So what options do we have? Well, one of our entry models tells us that when we have a move with
[10:33] small retracements, we can mark a Fibonacci level along the entire length of the move and wait for a deep retracement to enter our trade. Okay, so that's what I can do. We're going to mark our Fibonacci level here, from the
[10:47] beginning to the end of the move. Perfect. We mark our line in the Golden Zone of Fibonacci. The same entry model is the same one I have on the chart. I'm just missing a small confirmation. Also, I see—and this is super
[11:01] important, pay close attention—that where I marked the Golden Zone line is where I previously had a low here. So that gives much greater importance to our trades. Now I just need the chart to reach
[11:14] this point so I can trade downwards. And if you notice, we're not taking into account values like liquidity. Smart money concepts. Order blocks because that's not the methodology we're using. So, you might
[11:29] care as much about Fibonacci retracements or using a different methodology. And that's where many traders get confused. They mark
[11:41] support, resistance, and order blocks simultaneously, but each of these has different parameters. While support or resistance tells you it's the point where the chart pauses before changing direction, an
[11:55] order block tells you it's a liquidity zone where money is moving, where financial institutions have left a trail of liquidity. You're using two completely different parameters, and that's what causes the
[12:07] confusion. I'll usually put it this way: if you use traditional analysis, the trades you place tend to be quite simple because the entry patterns are already there. You don't have to
[12:19] invent anything. That's why I recommend you follow me on social media. You have all the details in the description. I'm sharing images of the simplest and most effective entry patterns you
[12:34] another chart so you can see one last example. For example, here's the Eurogen. We open our 5-minute timeframe chart. Okay, I'm going to increase the timeframe a little to see what zone I'm in. Here I have
[12:48] impulse, pullback, impulse, pullback, impulse, pullback, impulse. At the moment when an impulse is no longer greater than the previous one, or a pullback no longer respects the IOR, then we can look for a change in structure, the same as I
[13:03] mentioned before. Perfect. I would have marked my last low, which would be this one here. And if you notice, we have the same entry pattern again as a little while ago, which would be: I have an upward trend. Perfect. When an impulse or a
[13:20] pullback no longer respects the IOR, we expect a breakout, pullback, and we have a trade. So here I would mark my last low. Easy, okay. This is where confirm it, how am I going to confirm it?
[13:33] Well, I can mark a Fibonacci retracement, for example. And again, traders, the same entry pattern but with a different asset. We're seeing that it's in the Fibonacci Golden Zone, which also coincides with the last low. We already
[13:47] have a test. So at this moment, this is where I can prepare to enter a trade. But if you notice, no We're complicating our lives by marking 500 lines, marking channels, patterns, and indicators, not because we're
[14:01] using entry models. And just like chart patterns, entry models are quite simple figures that you just have to try to copy and paste onto the chart. And if the chart is showing them, then you're
[14:14] going to trade them, and most of the time that will result in perfect and precise trades. So I can tell you not to mix one methodology with another; quite the opposite. Stick with one and
[14:28] try to perfect your entry models. Each of the methodologies that exist today has its respective entry models. For example, with order blocks, well, there are patterns or entry models that tell you
[14:41] how to use order blocks, and learning all these models will help you have simpler, more effective trades, so that every time you open your charts you no longer feel completely blank. Because when that happens, that's when we
[14:55] start placing a lot of senseless trades, and that, our accounts. So, traders, I hope you liked this video and that you little more about the way I did. I analyze my charts
[15:09] quite simply and effectively. Be sure to subscribe to the channel, leave a like on next video with a great strategy. See you a great strategy. See you next time, traders!
⚡ Saved you 0h 15m reading this? Transcribe any YouTube video for free — no signup needed.