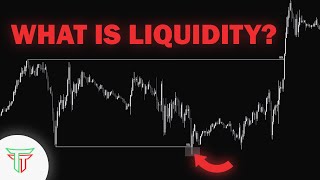

What Is Liquidity?
45sDefines a core trading concept in simple terms, appealing to beginners and sparking curiosity.
▶ Play Clip"Title accurately reflects content: a clear, practical intro to liquidity with chart examples."
This video provides a beginner-friendly introduction to the concept of liquidity in trading, explaining how to identify buy-side and sell-side liquidity on charts and use it to anticipate price movements. The presenter demonstrates how swing highs and lows act as liquidity zones where stop losses cluster, and shows how sweeping these levels often leads to reversals or continuations.
Liquidity refers to swing highs and lows on a chart. These are areas where stop losses are placed by traders in opposing positions, making them targets for price to 'sweep' before reversing.
External liquidity is the highest high or lowest low of a range, while internal liquidity are intermediate highs/lows within the range. Both act as magnets for price.
After sweeping sell-side liquidity, look for displacement higher, a pullback to a fair value gap (FVG), and then a continuation to buy-side liquidity. This is called the 2022 model.
The initial high or low after a liquidity sweep is often the first target (low hanging fruit). Take partial profits there.
Equal lows (or highs) act as strong liquidity magnets. When price sweeps them, expect a reversal back the other way.
Understanding liquidity—where stop losses cluster—helps traders anticipate price movements. By identifying external and internal liquidity levels and using the 2022 model (displacement, FVG pullback, continuation), traders can find high-probability setups.
What is liquidity in trading?
Liquidity refers to swing highs and lows where stop losses cluster, making them targets for price to sweep.
00:02
What is external liquidity?
External liquidity is the highest high or lowest low of a price range.
01:19
What is internal liquidity?
Internal liquidity are intermediate highs and lows within a range.
01:19
What is the 2022 model setup?
After sweeping sell-side liquidity, look for displacement higher, a pullback to a fair value gap, then continuation to buy-side liquidity.
01:47
What is the 'low hanging fruit' target?
The initial high or low after a liquidity sweep is often the first target (low hanging fruit).
03:35
What do equal lows act as?
Equal lows act as magnets for price; when swept, expect a reversal back up.
06:13
Liquidity Defined
Core concept of the video: liquidity = swing highs/lows where stops are placed.
00:02External vs Internal Liquidity
Key distinction that helps traders identify multiple target levels.
01:192022 Model Explained
Actionable trading setup: sweep, displacement, FVG pullback, continuation.
01:47Equal Lows as Magnets
Important pattern: equal lows often lead to reversals after being swept.
06:13[00:00] What's up guys, it's Justin back with a new video for you guys. Today we're going to be going over an introduction to liquidity. What is liquidity? How do we, you know, find it on our charts? How do we use it to our advantage? So just going to jump in. I want to talk about what exactly
[00:14] is liquidity. Now, when we're talking about liquidity on the charts, a lot of the times what we are referencing is any sort of, you know, swing high or swing low. Now you might be wondering, you know, why, why is that liquidity? Well, logically speaking, if anybody is in some
[00:29] sort of short position. If we're looking at, you know, this kind of 15 minute chart here on ES, if anybody's in some sort of short position, most of the time, they're going to put their stop loss at any sort of significant high. So marking out our significant high of the range, we can see
[00:44] this now becomes our buy side. Now all of buy side is sort of resting above this level, right? Because this is where everybody is placing their stops, right? Now, if I'm in a short position,
[00:57] all the stops are above here. This is where everybody would get stopped out, right? Now, what would be my sell side of this range? Now, my sell side would be right here because this is the low of this range, right? So anything below this area would be sell side liquidity.
[01:19] Now, how do we use it to our advantage, right? So there's something that we like to call external versus internal liquidity. Now looking at this specific range, this is our external buy side and our external sell side, right? Looking at this kind of chart here, what can we, what kind
[01:33] of internal levels can we use, right? Well, looking at this market right here, if we go to the left a little bit, we can see that we had a low put in here, sell side liquidity. And what happens after we sweep sell side? What do we expect to see after we sweep sell side? We look for some sort of
[01:48] reversal right So looking at the 15 minute here we put in a low sell side get swept and we have instant displacement back up Now what can we expect This is where we look for our 2022 model which is some sort of displacement higher and pull back to some sort of fair value gap to then go higher You can see we have a five minute fair value gap
[02:08] Once we sweep the sell side level, where can we expect to go? Possibly back to buy side, wait for pullback back to discounted fair value gap, enter long. And you can see this was a nice possible long setup where we come back into discount. We continue to hold this 15 minute
[02:24] for value gap, and then we can see this high getting met right after that. So this would be a valid setup as well. So now what can we expect after this, right? So what would be another internal buy side level, right? This would be external. We have internal buy side here.
[02:36] What happens after we sweep this, right? Big move up and then displacement right back inside this range. What can we expect to see? Whatever that recent low is, right? Whatever that internal sell side level is, which is this. So after buy side gets swept, internal buy side, if we get displacement
[02:52] back inside this range, right? Looks like markets fail to go higher here. If we get displacement back inside this range, I can expect markets to go to whatever that previous low is. And then this becomes our sell side, right? Again, right here, we have a low here. What can we expect to see
[03:07] after this sell side level is taken? A run up back to buy side. So what do we look for? This is where we look for our 2022 model we look for displacement back up you can see we have a market structure shift right here big displacement pull back to fair value gap on the 15 minute
[03:26] this is where your long entry would be you could set your your targets along the way most of the time i like to take off some of my position at that initial high low hanging fruit is this initial high let's look at some more examples all right so we have a new range here right looking at this
[03:42] range we want to mark out our buy side and sell side levels our external levels right external would be that external high and this would be our external sell side level right now a lot of the times these levels might not get taken right for us to take a trade but we want to keep in mind of our internal levels as well so let mark out our internal
[04:02] sell side you can see we had this low here what do we expect to see after this low gets taken some sort of buy back to the upside you can see we zoom back if we zoom into a smaller time frame
[04:15] you can see we get displacement back up what do we look for a fair value gap and discount pull back the discounted fair value gap and you could have seen this would have been a valid long
[04:27] to go higher let's look at another example here let's mark out our external levels we can see we this would be our buy side now what do we expect to see after our buy side's taken we could expect to see whatever our sell side is and at this point in time this would be the most recent low that
[04:43] we've created and this would be acting as our sell side liquidity now we can see all of these internal levels as well. You can see internal liquidity gets swept right here. Internal gets swept, big displacement back up. What can we expect to see? Buy side, internal buy side would
[04:58] have been here. And then we run up to this to take out that external level. Now, what can we expect to see after that external level is taken? Well, we could see sell side. So let's see, let's zoom in. Looking at the five minute, you can see this was our buy side on the external being swept.
[05:13] we get big displacement back inside this range what do we look for discount fair value gap you can see if i draw my fib in from the high to the low you can see we retrace back into discount this is where your short would be your low hanging fruit first target would be that initial low
[05:29] your second target would then be that external sell side liquidity level that then gets taken right here you can see liquidity markets move based off liquidity we always are targeting liquidity right so being able to understand how markets move understand the displacement
[05:42] understand how to use it to your advantage that's going to be the best thing so looking at this exact same thing what do we expect to see after sell side look so we come down sell off sell sides then taken right all of these sell stops are now getting triggered And then we get an instant push right back to the upside Let look at another example here Looking at the 15 minute where does our buy side rest
[06:02] Our external high. Where would be our external sell side? This low here. Now, where would be our internal sell side level?
[06:14] This right here. Notice equal lows. We always want to mark an equal lows and we know equal lows are gonna act as a magnet. So what do we expect after these equal lows to get taken? Buy back up. What do we look for? Market structure shift.
[06:26] You can see five minute break here. Pull back to that fair value gap. You can see it pull back here and then we get a nice run up. Pull back one more time and then we get a run up to that buy side level, right? Another example, we have clear external buy side above us,
[06:41] clear sell side below us. Here we go. Come down, sweep these lows. You can see we start to consolidate, right? All those sell stops are now getting triggered. What can we expect? Bounce back up, right? One more example here, looking at the charts, where can we see our buy side?
[06:54] This would be our external buy side. We have some internal buy side here as well. And then we have this external sell side level being swept here, right?
[07:06] What do we expect after seeing this low being swept? Notice we have a low being swept. Right here is where all those sell stops are now being triggered. and we can see we get a big move back up to take out that previous high so hopefully you guys
[07:21] learned something from this this is sort of you know a quick video on understanding liquidity how to recognize it didn't want to you know over complicate you guys with you know a bunch of words or you know examples so hopefully this helped you kind of understand how to use them a little bit
[07:33] better and recognize you know what might be the draw on liquidity especially i plan on making a more in-depth video on the draw on liquidity specifically but hopefully this gave you a little bit of a better idea on what liquidity is and how to use it to your advantage. So, well, thank you
[07:47] guys for watching. Make sure to leave a like, subscribe, comment as always, and I'll see you guys in the next one. Peace.



⚡ Saved you 0h 07m reading this? Transcribe any YouTube video for free — no signup needed.