
The Most Accurate Bitcoin Indicator?
40sReveals a tool that claims to pinpoint exact Bitcoin tops and bottoms, sparking curiosity and debate among traders.
▶ Play Clip"Delivers exactly what the title promises — three concrete tools for timing Bitcoin trades, though it's brief and lacks in-depth explanation."
This video presents three technical indicators designed to help traders identify optimal Bitcoin entry and exit points. The creator demonstrates how to configure each tool on TradingView or Glassnode and explains the signals they provide for long-term buying and selling decisions.
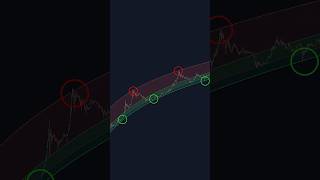
Go to TradingView, add the 'Bitcoin Power Log Corridor' indicator, and switch the chart to logarithmic scale. The tool marks historical bottoms (green line) and tops (red line) with high accuracy.
Add the 'Bitcoin Cycle Master' indicator, uncheck all settings except 'plot terminal price'. When price touches the yellow line, Bitcoin is overextended and it's time to take profit.
Use the MVRV Z-Score on Glassnode to gauge long-term holder profit ratios. Red zone = majority in profit → sell; green zone = majority at a loss → buy.
By combining these three indicators, traders can make more informed decisions about when to enter or exit Bitcoin positions, based on historical accuracy and market sentiment.
What is the first indicator mentioned for Bitcoin trading?
Bitcoin Power Log Corridor on TradingView.
00:02
What chart scale should be used with the Power Log Corridor?
Logarithmic scale.
00:15
What does the yellow line in Bitcoin Cycle Master indicate?
Bitcoin is overextended and you should start taking profit.
00:57
What does the MVRV Z-Score measure?
The profit ratio of long-term Bitcoin holders.
01:12
When should you enter a long position according to MVRV Z-Score?
When the majority of traders are trading at a loss (green zone).
01:24
Three-Tool Strategy
Provides a complete, actionable framework for timing Bitcoin trades.
00:02Logarithmic Scale Importance
Emphasizes the need for proper chart scaling to use the indicator correctly.
00:15MVRV Z-Score as Sentiment Gauge
Uses on-chain data to measure market sentiment and contrarian signals.
01:12[00:02] know exactly when to buy and sell Bitcoin First Step go to trading view if you don't yet have it I'll leave a link in my bio next go to the indicators tab type in Bitcoin Power log Corridor click this one by this guy the chart should
[00:15] bottom right of your chart and click this little icon switch from regular to logarithmic this tool is extremely accurate on a long-term basis for buying and selling Bitcoin and it's pretty easy to use every time Bitcoin hits this
[00:30] single time Bitcoin has come down here it has been the absolute bottom whenever Bitcoin has come to this red line it has been the absolute top and just look how accurate this tool has been in the past
[00:42] great tool moving on next go to the indicators Tab and type in Bitcoin cycle Master go to the settings uncheck all of these boxes besides plot terminal price this indicator will tell us when to start looking to sell Bitcoin once price
[00:57] touches this yellow line it means Bitcoin is overextended and you should start looking to take profit also look how accurate it has been in the past moving on next tool it's called mvv zcore on glass node I'll leave a link in
[01:12] the description this will basically tell us the profit ratio of long-term holders of Bitcoin so when the majority of Traders are trading for a profit which is the red zone we should look to seller position when the majority of Traders
[01:24] are trading for a loss which is this green zone we should look to enter long position go use these three tools and see where Bitcoin currently is it might see where Bitcoin currently is it might just surprise you
⚡ Saved you 0h 01m reading this? Transcribe any YouTube video for free — no signup needed.



![BEST MACD Trading Strategy [86% Win Rate]](https://img.youtube.com/vi/rf_EQvubKlk/mqdefault.jpg)