
Can You Predict This Price Move?
45sInteractive challenge grabs attention and tests viewers' skills immediately.
▶ Play Clip"The title promises a skill test, but the content is a brief, basic chart analysis with a predictable outcome; it's more of a teaser than a comprehensive tutorial."
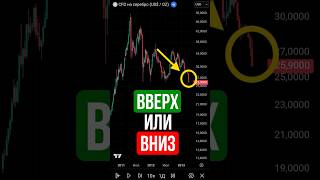
This video is a technical analysis exercise where the presenter walks through a price chart to identify patterns and predict the likely direction of the next price movement. The analysis focuses on candlestick patterns, support levels, and the formation of a double top pattern, concluding with a downward price prediction that is then confirmed by the actual market outcome.
The video opens with a challenge to the viewer to analyze a bare chart without hints and determine whether the price is more likely to go up or down.
After an uptrend, two red candles with long bodies appear, indicating strong selling pressure from sellers.
Two distinct highs are visible, forming a double top pattern, but it is not yet confirmed because the neckline (horizontal support level) has not been broken.
The candle closes at a level where sharp bounces previously occurred, as seen by the shadows, suggesting a likely breakout of the support level.
Considering all factors, the verdict is that the price is more likely to move down.
The price breaks the horizontal support level and moves lower, confirming the analysis. The presenter encourages subscribing to learn and develop market intuition.
Double Top Pattern Recognition
Demonstrates a classic technical analysis pattern that traders use to predict reversals.
00:30Prediction Based on Multiple Factors
Shows how combining candlestick patterns and support levels leads to a more confident forecast.
00:56Confirmation of Analysis
Validates the analysis process by showing the actual price movement, reinforcing the method's effectiveness.
01:10[00:00] Куда пойдет цена с большей вероятностью? Проверим твои навыки анализа. Никаких подсказок, только голый график. Найди паттерны и определи, куда пойдет цена. Вверх или вниз.
[00:18] Анализируем вместе. Ситуация образовалась после восходящего тренда. Далее мы видим образование двух красных свечей с длинными телами. Здесь и здесь.
[00:30] Это указывает на силу продавцов. Также мы видим образование двух ярко выраженных максимумов. То есть перед нами фигура двойная вершина. Но она еще не сформирована.
[00:42] Не сформирована, поскольку линия шеи, то есть вот этот горизонтальный уровень поддержки, еще не был пробит. Тем не менее мы видим, как свеча закрывается там, где ранее происходили резкие отскоки.
[00:56] Это видно по теням. Данное закрытие свидетельствует о вероятном пробитии уровня поддержки. Учитывая совокупность факторов, вердикт – цена с большей вероятностью направится вниз.
[01:10] Смотрим, что в итоге произошло с ценой. Цена пробила горизонтальный уровень поддержки и направилась на понижение. Подпишись, чтобы обучаться и развивать насмотренность. Рынок легче, чем кажется.
⚡ Saved you 0h 01m reading this? Transcribe any YouTube video for free — no signup needed.