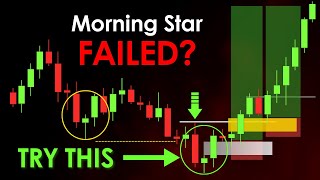

Why Morning Star Pattern Fails?
43sDirectly addresses a common trader frustration, promising a solution to a widespread problem.
▶ Play Clip"Delivers a solid, actionable strategy with real chart examples, but the title's promise of 'high accuracy' is somewhat oversold given the complexity and need for subjective interpretation."
This video explains how to trade the Morning Star candlestick pattern with high accuracy by adding confirmations like higher timeframe key levels, fair value gaps, and respecting candles. The presenter shares his personal approach to avoid common failures and improve win rates.
Many traders use the Morning Star pattern but still get stop loss hit; 90% use it incorrectly.
A bullish reversal pattern: first a strong/medium bearish candle, then a small body candle (1-3), and finally a strong bullish candle. Color of small candle doesn't matter.
The main issue is deciding which level marks the end of a downtrend; the presenter will share his personal approach.
1) Green candle closes below 50% of first red candle – weak reversal. 2) Green candle closes above 50% – better. 3) Gap up open and strong close covering first candle – best possible picture.
For higher timeframe bias, only consider the third picture. For lower timeframe entries, either of the two better patterns can be used.
The pattern should form at a higher timeframe key level like Order Block, Order Flow, or Fair Value Gap.
When price approaches the key level, a clear bearish Fair Value Gap should form in the opposite direction – a manipulation gap to trap retailers.
A three-candle pattern where a gap is created between the high/low of the first and third candles.
A strong bullish candle must close above the bearish Fair Value Gap, completely disrespecting it.
With higher timeframe alignment, a new bullish Fair Value Gap should form on the lower timeframe, showing alignment on dips.
The opposite pattern for selling opportunities; every point is opposite to the Morning Star.
First case: price hit stop loss because no higher timeframe key level and no bullish FVG. Second case: price reacted to order flow, manipulation FVG, bullish candle disrespected it, and a bullish FVG formed – successful trade.
Price broke a previous high creating order flow on 1H. On 5M, a Morning Star formed, but no bearish FVG initially; however, price behavior showed a bearish FVG in the opposite direction. After liquidity sweep, a proper Morning Star formed, and entry could be taken at the FVG or after a respecting candle.
Target the opposing high; price achieved target within 4-5 candles. Trail stop loss when price approaches opposite swing points.
Price approached a daily order flow level. On 1H, a Morning Star formed, but waiting for a pullback to create a bullish FVG gave a better entry with stop loss below the low and target at the high.
On 4H, an Evening Star formed with a bearish FVG. On 15M, price created a lower low, then a proper Evening Star with a manipulation FVG aligned with the higher timeframe FVG. Entry after respecting candle, stop loss above, target 1-2 RR achieved.
By combining the Morning Star/Evening Star pattern with higher timeframe key levels, fair value gaps, and respecting candles, traders can significantly improve their win rate and avoid common failures.
90% of traders misuse the Morning Star pattern
Highlights the core problem the video aims to solve, setting the stage for a refined approach.
00:12Higher timeframe key level as first confirmation
Emphasizes the importance of context over pattern alone, a key principle for trading success.
02:41Bullish candle must disrespect the bearish FVG
Provides a clear, actionable rule for confirming strength, reducing ambiguity.
03:49Price achieved target within 4-5 candles
Demonstrates the effectiveness of the approach with a concrete example, boosting credibility.
08:44Combining HTF key levels and FVGs for high-probability trades
Summarizes the entire strategy into a reusable framework, making it applicable to various market conditions.
13:25[00:00] morning star pattern लेकर trade लिया और फिर भी stop loss hit हो गया सब कहते हैं कि ये एक strong bullish pattern है लेकिन जैसे ही आप trade लेते हो market उल्टा आपका stop loss hunt कर देता है
[00:12] the question is अगर morning star pattern इतना powerful है तो फिर ये इतना fail क्यों होता है the reason is 90% of the traders morning star pattern को गलस तरीके से use करते है so hello traders welcome again to the channel I am jorjeet and back with a new learning video
[00:28] आज के इस वीडियो के थूँ मैं आपको exactly वही approach बताऊंगा जो मैंने develop किया है और इस traditional candlestick pattern को और भी कुछ added confirmation के साथ मैं कैसे trade करता हूँ और कैसे आप भी high accuracy और win rate maintain कर सकते हो
[00:43] हर चीज हम step by step आज discuss करेंगे चलो अभी वीडियो को start करते हैं और complete process को properly समझने के लिए video को skip किये दिना आपको enter देखना है. How to identify this pattern?
[00:56] Traditional theory की हिसाब से यह एक bullish reversal pattern है, जहाँ पे first एक strong या medium weight candle create होता है, indicating the selling pressure. And उसके बाद एक small body candle के थूँ selling momentum को absorb किया जाता है.
[01:12] And finally एक bullish candle formation के साथ trend reversal को indicate किया जाता है. यहाँ पर small body candle एक से जादा भी हो सकता है maximum एक से तीन तक हम consider कर सकते हैं
[01:24] and इस case में color भी pattern नहीं करेगा like यहाँ पर green या red कोई भी candle बन सकता है also as per traditional approach यह pattern आपको बिलकुल down trend के end में देखने को मिलता है
[01:36] but the problem is हम कैसे decide करें कौन सा level down trend का end है इसलिए मैं आगे मेरा personal approach भी share करूँगा यहाँ पर three different picture है with different probability
[01:48] look at this picture इस case में जो green candle है वो first red candle के 50% level के उपर close नहीं हो रहा है जिसका मतलब buyers में उतना strength नहीं है and यहाँ से reversal का chances भी कम है
[02:02] लेकिन यहाँ पर एक proper green candle दिख रहा है जिसका close clearly first candle के 50% level से उपर है and finally यहाँ second candle gap down open होता है फिर एक strong green candle clear gap up के साथ create होता है
[02:17] जो first candle को almost cover भी कर लेता है but आपको याद रखना है अगर third candle gap up के साथ open हुआ है and strongly close भी कर रहा है then it is the best possible picture
[02:29] अगर सिर्फ higher time frame bias की बात करें तो हमें सिर्फ third picture को ही consider करना चाहिए लेकिन lower time frame entry के लिए हम इन दोनों में से कोई भी pattern को consider कर सकते हैं
[02:41] Now मैं personally इस pattern को कैसे trade करता हूँ एक बार देख लेते हूँ अगर added confirmation की बात करें तो सबसे पहले मेरे हिसाब से ये pattern कोई भी higher time frame key level के उपर बनना चाहिए
[02:55] Higher Time Frame Key Level यहाँ पे Order Block, Order Flow या Fair Value Gap हो सकता है उसके बाद जब Price Higher Time Frame Key Level को Approach कर रहा है तब Opposite Direction में एक Clear Bearish Fair Value Gap create होना चाहिए
[03:09] Basically यह Fair Value Gap एक Manipulation Fair Value Gap है जिसके थूँ Retailers को Manipulate किया जाता है अगर आपको नहीं पता है तो Fair Value Gap Basically एक Three Candle Pattern है जहाँ पे first and third candle के high and low के दिन एक gap create होता है
[03:25] इसके उपर और भी detail में जानने के लिए आप ये वाला वीडियो जरूर देख लेना proper and structured learning market fair value gap mentorship program join fair value gap market structure systematic approach market time frame intraday swing trade logically and confidently trade
[03:49] इसके बाद एक strong bullish candle form होना चाहिए आपको याद रखना है कि इस bullish candle का closing इस bearish fair value gap के उपर होना चाहिए मतलब इस bearish fair value gap को completely disrespect करना जरूरी है
[04:03] and finally higher time frame alignment के साथ एक new bullish fair value gap lower time frame पे create होना चाहिए जब higher time frame पर price bullish order flow या fair value gap के उपर create कर रहा है
[04:17] तो lower time frame पे ये bullish fair value gap drop पर alignment शो करता है finally respecting candle के through हम और भी जादा confirmation ले सकते है जो कि हम आगे chart पर बात करेंगे
[04:29] in similar way हम इसके opposite pattern को भी trade कर सकते है जिसको evening star candlestick pattern बोला जाता है यहाँ पे हर एक point morning star pattern से just opposite है and आपको यहाँ पर selling opportunity find out करना होता है
[04:44] यहाँ पर इस टाट के अंदर हमें दोनों जगा morning star pattern create होते हुए दिख रहा है लेकिन first case में price ने soft loss hit कर दिया So अभी हम हर एक point को step by step check करते हैं
[04:56] पहले price ने इस level के उपर एक bearish fair value gap create किया जो एक manipulation है लेकिन यहाँ पर price कोई भी higher time frame key level के उपर trade नहीं कर रहा है And also यहाँ पे कोई bullish fair value gap भी create नहीं हुआ
[05:11] लेकिन अगर हम यहाँ पे देखे तिन यहाँ पे price पहली बात तो एक higher time frame order flow से react कर रहा है बाद में एक manipulation fair value gap भी create हुआ है And इस bullish candle ने इसको completely disrespect भी किया है
[05:26] And finally हमें एक bullish fair value gap भी मिल चुका है And यहाँ पे एक respecting candle भी create हुआ है candle formation के बाद भी entry ले सकते हैं, इसके बाद भी आप देख पाओगे, price previous fair value gap को respect करते हुए,
[05:45] इस level के उपर एक new fair value gap create किया है, जो हमें और भी जादा confirmation provide करता है, and हम इस fair value gap के उपर भी entry ले सकते हैं, और भी जादा confirmation के साथ, अभी हम real chart के उपर इन सारे concepts को
[06:01] in depth breakdown करके explain करने की try करेंगे and आप clearly समझ पाओगे higher time frame की level find out करके कैसे lower time frame को approach करना है जिसके बाद आप एक high probable trade find out कर सकते हो
[06:15] अभी हम इस one hour chart के अंदर देख पा रहे हैं कि price is high को clearly break किया है जब भी price कोई भी previous high को break करता है तो वहाँ पे एक order flow create होता है अभी ये जो level है ये हमारे लिए higher time frame पे एक important level है
[06:30] यानि कि ये key level है तो यहाँ जे हम lower time frame यानि कि 5 minute पे जाके हम check करेंगे कि यहाँ पे कोई entry हमारे पास मिल जाए की नहीं अगर हम 5 minute पे देखेंगे कि यहाँ पे जब price approach करेगा
[06:43] morning star pattern create then upside trade price play clearly price level properly morning star pattern create morning star pattern first red candle small body candle and green candle previous rate candle completely cover added confirmations check clearly bullish fair value gap
[07:14] वाला bullish fair value gap है and also price higher time frame यानि की one hour order flow के ऊपर trade कर रहा है लेकिन यहाँ पे आपको directly एक bearish fair value gap नहीं दिख रहा मतलब हमारा conditions match नहीं कर रहा है लेकिन अगर आप price behaviour को समझते हो and market psychology को
[07:32] समझते हो तो आपको इस level पे एक proper fair value gap दिखेगा जो की एक bearish fair value gap है and it is in the opposite direction of this bullish order flow on the higher time frame तो ultimately price ये जो bearish fair value gap create हुआ है
[07:47] यहाँ पे थोड़ा बहुत rejection तो दिया है लेकिन price यहाँ पे कोई new fair value gap नहीं create कर पाया and also price higher time frame key level को approach कर चुका है बाद में आप यहाँ पे देख पाऊँगे की price यहाँ पे clearly liquidity sweep कर रहा है जो की और भी एक indication है की price
[08:03] opposite direction में move कर सकता है then price यहाँ पे proper morning star pattern create कर रहा है इस pattern के ऊपर इस fair value gap से हम directly create कर सकते हैं लेकिन अगर हमें और भी जादा confirmation लेना है
[08:15] तो हम एक respecting candle बनने का wait कर सकते हैं यहाँ पे आप clearly देख सकते हैं हमारे पास एक respecting यानि की rejection candle है अगर यहाँ पे भी आपको confusion है तो इसके बाद जो candle create हुआ है यहाँ पे भी आप देख सकते हो यह candle fair value gap के ऊपर close किया है
[08:30] तो आप यहाँ से भी अपना entry place कर सकते हो अगर हम यहाँ से entry लेते हैं तो इस low के ऊपर अपना stop loss रहेगा और target के हिसाब से इस opposing high को target किया जा सकता है तो ultimately हमारा target first target जो है वो यहाँ तक होगा
[08:44] तो आप clearly देख पाओगे price बहुत ही fast within 4-5 candle आपका target achieve करके भी दे देगा बाद में आप clearly देख पाओगे कि price यहाँ पे एक new fair value gap create किया है
[08:56] and lower time frame के उपर यहाँ पे एक order flow भी overlapping है मतलब यह जो high है इस high को break करते हुए price ने एक fair value gap create किया तो ये और भी जादा confirmation है और इसके बाद भी आप देख सकते हो
[09:08] प्राइस एक respecting candle create कर रहा है तो ultimately यहाँ से भी आप अपना next entry ले पाओगे and at least 1-2 hour तक target कर सकते हो लेकिन यहाँ पे आपको याद रखना है जब price opposite कोई भी swing point या high को approach करता है
[09:23] तो यहाँ से price reverse भी कर सकता है so इस level पे price approach करने के बाद आपको साथ ही साथ अपना stock loss भी trail करते वे चलना है तो ultimately हमने देखा कि morning star pattern को
[09:36] अगर हम higher time frame key level and lower time frame पे fair value gap and respecting candle के साथ trade करते हैं तो हम multiple times entry भी ले सकते हैं and बहुत ज़्यादा high confirmation के साथ
[09:48] अपना trade को execute कर सकते हैं अभी फिर से इस chart के अंदर हमारे पास order flow level है क्योंकि price ने यहाँ पे इस high को break किया है तो यह जो order flow higher time frame का level है तो इस level पे price आने के बाद हम कैसे trade कर सकते हैं
[10:02] तो यह daily का time frame है और अगर price one hour पे इस level को approach कर रहा है और अगर आप देखोगे कि one hour time frame पे
[10:18] added confirmation entry fair value gap wait clearly bullish fair value gap entry confirmation
[10:49] लोगे लेकिन आप अगर ये candle बनने के बाद entry लेते हो तो यहाँ पे तो आप सही हो जाओगे लेकिन बहुत बार आपका stop loss hit हो जाएगा stop loss को avoid करने के लिए हमें थोड़ा सा wait करना है और यहाँ पे
[11:02] आप देख सकते हैं price थोड़ा सा रिक्रेस करके जब upside move किया है एक fair value gap create किया है and इस fair value gap formation के साथ ही हम अपना entry को place कर सकते हैं तो यहाँ पे हम अपना entry ले सकते हैं and stop loss यहाँ पे रहेगा
[11:15] and target के लिए हम initially यह high को target करी सकते हैं या 1-2 तक भी हम अपना target ले सकते हैं तो clearly आप देख पाओगे कि 1-2 तो price बहुती sharp momentum के साथ आपको achieve करके दे दिया है
[11:28] Finally इस chart के उपर हम एक bearish example को भी discuss कर लेते हैं और देखते हैं हम evening star candlestick pattern को कैसे create कर सकते हैं तो यहाँ पर जैसे कि आपको दिख रहा है एक bullish candle उसके बाद दो small body candle
[11:41] and then एक strong bearish candle यह हम higher time frame की बात कर जाएं क्योंकि already मैंने बोला है कि हम यह candlestick pattern को higher time frame bias decide करने के लिए भी use कर सकते हैं उसके बाद आप देख सकते हो यहाँ पे एक bearish fair value gap भी create हुआ है on the higher time frame जिसको हम lower time frame के उपर as a key level use कर सकते हैं
[12:00] अभी ये 4 hour का time frame है, अगर हम 15 minute time frame पे जाके इस chart को observe करते हैं, तो यहाँ पे कोई भी हमें evening star pattern देखने को नहीं मिल जाए, बाद में price lower low create कर रहा है, and finally यहाँ पे जाके हमें proper तरीके से एक evening star candlestick pattern देखने को मिल जाए,
[12:17] और यहाँ पे price higher time frame fair value gap या फिर higher time frame पे even sir canons की pattern create करने के बाद ही downside आ रहा है and also यहाँ पे आप observe कर सकते हो कि price ने यहाँ पे इस level पे
[12:30] एक order flow level create किया क्योंकि यह जो low है price ने इस low को proper तरीके से break भी किया है ultimately यहाँ पे आपको एक manipulation fair value gap दिखेगा and एक ऐसा fair value gap दिखेगा जो कि higher time frame fair value gap के
[12:44] proper alignment पे है तो यहाँ से भी आप directly create कर सकते हो and यहाँ पे ये fair value gap से properly reject करते हुए price ने एक respecting candle भी create किया है तो ultimately यहाँ
[12:56] से बहुत ज़्यादा confirmation के साथ हम अपना entry place कर सकते है तो यहाँ पे हमारा entry is respecting candle के बाद भी हो सकता है या फिर is fair value gap के ऊपर भी हो सकता है stop loss यहाँ पे रहेगा and finally हम at least one is to two risk reward को target कर सकते है तो यहाँ पे आप clearly देख सकते हो
[13:13] कि price बहुत ही easily आपका target आपको achieve करके दे दिया है even आप देख पाओगे की price ने यहाँ पे भी एक fair value gap create किया सा on the downside and इसी fair value gap से react करते है
[13:25] price में downside momentum किया. तो ऐसे ही हम higher time frame key level, order flow, order block and fair value gap के help से morning star या evening star pattern को बहुत ही high probability के साथ with added confirmation create कर सकते हैं. So I hope कि इस video से आपको बहुत ज्यादा
[13:41] help मिला है. ऐसी और भी exclusive और advanced concept सीखने के लिए आप fair value gap mentorship की program check out कर सकते हैं साथ ही comment करके बताना की आप पहले morning star pattern को कैसे trade करते थे finally live market update के लिए आप description में दिये हुए link से हमारे telegram channel को join भी कर सकते हो
[13:58] so आज के लिए इतना ही रखते हैं मिलते हैं next video में तब तक लिए stay safe stay profitable and happy trading
[14:16] झाल
⚡ Saved you 0h 14m reading this? Transcribe any YouTube video for free — no signup needed.