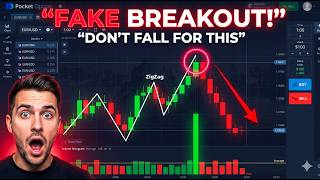

Why Fake Breakouts Trap You
60sExplains a common painful trading mistake with a clear, rule-based solution, making it highly relatable and educational.
▶ Play Clip"Title accurately reflects the strategy's focus on fake breakouts and 1-minute trading."
This video presents the Zig Zag Volume Exhaustion Strategy for Pocket Option, a rule-based approach combining the Zig Zag indicator with volume analysis to identify market exhaustion points. The strategy focuses on 1-minute candles with a 2-minute expiry, aiming to capitalize on momentum shifts when buyers or sellers run out of steam.
The market hits a new high but crashes, trapping traders who thought it was a breakout.
The Zig Zag Volume Exhaustion Strategy is a strict, rule-based setup using Zig Zag and volume indicators to pinpoint exhaustion.
Use 1-minute candles, add Zig Zag and volume indicators only. Volume bars have a midline reference point.
Every market push is powered by volume; exhaustion occurs when one side runs out of fuel. Zig Zag marks legs, and volume confirms exhaustion.
1) Zig Zag forms a new high leg. 2) Volume bar on that candle is above midline and higher than previous three candles. 3) Enter 2-minute sell trade at candle close.
Mirror of sell: new low leg, volume above midline and higher than previous three candles, enter 2-minute buy trade.
The strategy waits for volume-based evidence of exhaustion, not guessing reversals.
A PDF with settings, checklists, and entry rule card is available in the description.
Zig Zag new high, volume spike above midline and higher than previous three candles. Entered 2-minute sell, trade closed in the money.
Entered buy trade on new low without volume confirmation (volume was green and weak). Trade resulted in loss.
Zig Zag new high with massive volume spike above midline. Entered 2-minute sell, trade closed successfully.
Consistent wins with one loss; emphasizes mechanical edge and discipline.
The Zig Zag Volume Exhaustion Strategy provides a mechanical edge by waiting for volume confirmation of exhaustion. Discipline and strict rule-following are essential; practice on a demo account before risking real capital.
What two indicators are used in the Zig Zag Volume Exhaustion Strategy?
Zig Zag indicator and volume indicator.
01:24
What is the candle time frame used in this strategy?
1-minute candles.
01:24
What is the expiry time for trades in this strategy?
2-minute expiry.
00:42
What are the three rules for a sell trade trigger?
1) Zig Zag forms a new high leg. 2) Volume bar on that candle is above midline. 3) Volume is strictly higher than previous three candles.
02:35
What does a volume spike above the midline and higher than previous three candles indicate?
Buying or selling exhaustion, meaning the momentum is likely to reverse.
02:35
What is the fatal flaw in the failed trade example?
Entering without volume confirmation; the volume bar was green and weak, not a massive spike above midline.
07:09
Why is a 2-minute expiry used instead of a longer one?
It gives enough time for the reversal to confirm but not enough for a secondary trend to develop.
10:02
Volume Exhaustion Concept
Explains the core principle that every market push is powered by volume and exhaustion signals reversals.
01:53Sell Trade Trigger Rules
Provides clear, actionable rules for entering a sell trade based on volume confirmation.
02:35Failed Trade Example
Demonstrates the consequence of ignoring volume confirmation, reinforcing the strategy's discipline.
06:44Trade History and Discipline
Emphasizes that trading is about mechanical edge and discipline, not a perfect win rate.
10:30[00:01] the market hits a brand new high, only to watch it instantly crash back down? You thought it was a breakout, but instead, you got trapped. It happens to the best of us, and here's the hard truth. It will keep happening until you
[00:14] happened. Welcome back to Sam Trading Strategies. Today, I'm breaking down the Zig Zag Volume Exhaustion Strategy for Pocket Option, and this one is different. This isn't about guessing the next move. This
[00:29] is a strict, rule-based setup where we combine the standard Zig Zag indicator with raw volume to pinpoint the exact moment buyers or sellers have completely run out of steam. In this video, the exact indicator settings, the specific
[00:42] trigger rules for 1-minute candles, and why we use a strict 2-minute expiry. No why we use a strict 2-minute expiry. No fluff, just the setup. And as always, there is no such thing as a 100% win rate in trading. Capital protection
[00:55] always comes first. Watch this full breakdown, understand the logic, and test it on a demo account before you risk a single rupee. Let's get into the charts. Quick, but important. Binary options trading carries real financial
[01:09] risk. Everything in this video is strictly for educational purposes. If account. Build your confidence there first. Now, let's talk strategy. All right, before we touch a single trade, let me show you exactly how this chart
[01:24] needs to look. Clean, simple, two indicators only. Set your candle time frame to 1 minute. Then go to your indicators and add two things, the standard Zig Zag and the standard volume indicator. That's it. No extra lines, no
[01:39] display bars at the bottom of your chart, and you'll notice there's a midpoint line running through those bars. That line is your reference point for the entire strategy. Keep it clearly visible at all times.
[01:53] understand this, it will change the way you look at market moves forever. Every push in the market, whether up or down, is powered by volume. Buyers pushing price up, sellers pushing price down.
[02:07] But no push lasts forever. At some point, one side runs completely out of fuel. That moment of exhaustion, that is what we're hunting. The Zig Zag shows us the legs of each market push. When a new high or new low forms, the Zig Zag marks
[02:21] it. And right at that moment, we check one thing. How much volume powered that move? If the volume was massive, above the midline, and higher than the last three candles, it means the market threw everything it had at that level, and it
[02:35] couldn't hold. That side is done. That is your signal. Let's go through the exact sell trade trigger. Write these down. Rule one, the high. Wait for the Zig Zag to form a brand new high leg. Don't anticipate it, let it fully form.
[02:50] Rule two, the volume spike. Look at the volume bar on that exact candle that made the high. Rule three, the confirmation. That volume bar must be above the midline, and it must be strictly higher than the volume of the
[03:03] previous three candles. All three rules must be met, not two out of three. All three. When you see this, a massive buying surge just hit the market, but price couldn't sustain it. The buyers are exhausted. The moment that candle
[03:18] closes, you enter a 2-minute sell trade. The buy trade is the exact mirror image. Rule one, the low. Wait for the Zig Zag to create a confirmed new low leg. Rule two, the volume spike. Check the volume on that specific low candle. Rule three,
[03:34] the confirmation. Volume above the midline. Volume strictly higher than the previous three candles. Same rules, opposite direction. Sellers threw push it further. Enter a 2-minute buy trade the moment that candle closes.
[03:49] The reason this works is simple. We are not fighting the trend. We are not guessing reversals out of nowhere. We are waiting for evidence. Hard, visible, volume-based evidence that the current momentum has run completely out of gas.
[04:03] No fuel left. Nowhere else to go but the other direction. That is the edge this strategy gives you. Before we get into the live chart examples, I've put together a free PDF guide covering everything we just went over. The exact
[04:16] Zig Zag and volume settings, the full sell setup checklist, the full buy setup checklist, and a quick reference entry rule card you can keep open while you practice. The link is in the description. Download it, keep it beside
[04:29] you while you practice, and use it until these rules become automatic. But knowing the rules is only half the job. The real test is what happens when the market looks like the setup, but isn't. The fake signals, the almost setups, the
[04:43] moments where patience saves your account. Coming up next, I'm walking you through a live, unedited trade. Exactly how I spot the setup, exactly what I check before entering, and exactly what the result looked like. No editing, no
[04:57] cherry-picking, real trading. Stay with me. All right, let's look at exactly how this plays out in the real market. We are looking at the chart on the 1-minute time frame, and I want you to pay very close attention to the setup forming
[05:10] here. The market had been pushing upward steadily, and our Zig Zag indicator just stretched out to lock in a brand new high leg. To the untrained eye, this that you should buy into. But look closely at our volume indicator at the
[05:24] bottom. The volume bar on that exact breakout candle is a massive green spike average line, and it is significantly higher than the previous three candles combined. The buyers gave it absolutely everything they had on that last push,
[05:38] but the price is struggling to hold that level. This is the exact definition of buying exhaustion. Recognizing that the momentum is totally tapped out, I immediately execute a 2-minute sell trade for $108.
[05:52] during the trade. This right here is the moment where most beginner traders start to panic. But as rule-based traders, we simply trust the system. As we cross the 1-minute mark, you can see exactly why we use a
[06:06] 2-minute expiration. The market immediately stalled at that high, and aggressively red. The buyers have absolutely no strength left to keep pushing the price up, and the sellers are now actively stepping in
[06:20] to drag the market back down. We have a comfortable cushion here, but we always wait for the final close. And there is the final close. Two full minutes have passed, giving the market exactly enough time to complete its
[06:32] reversal, printing two solid downward candles in a row. The trade closes perfectly in the money. Now, let's look at the flip side, because I want to be completely transparent with you. This next example is exactly what happens
[06:44] when you let emotions take over and ignore the strategy's strict rules. We are looking at the chart on the 1-minute time frame, and you can clearly see a massive, aggressive downtrend forming. The Zig Zag indicator finally stretches
[06:56] out to create a new low leg, and it is very tempting to think the market has dropped enough and simply has to reverse right now. Acting on that assumption, I go ahead and enter a 2-minute buy trade. But look closely at our volume indicator
[07:09] at the bottom. This is the fatal flaw of this setup. For a valid selling exhaustion trade, we need a massive red volume spike to show that the sellers are completely trapped. Instead, the volume bar on our entry candle is green.
[07:22] It is noticeably weak, and it does not break above our middle line or tower over the previous three candles. The sellers are not exhausted here. They are just taking a brief pause. By entering this trade without that
[07:34] crucial volume confirmation, we are blindly trying to catch a falling knife. Let's see exactly how the market punishes this premature entry. As we move into the progress of the trade, the harsh reality of the momentum sets in.
[07:47] exhaustion to stop the sellers, the downward pressure simply resumes with full force. The price action violently crashes through our entry point, pushing even deeper into the trend, and the Zig Zag indicator is forced to drag its low
[08:01] point even further down. With the 2-minute expiration ticking away, the position is heavily underwater. This is the exact moment where trading anxiety usually hits. But the market is just doing exactly what the weak volume
[08:14] indicator warned us it would do. And here is the final close. The 2-minute timer expires. The market never manages to recover, and the trade closes as a complete loss. I am showing you this raw reality because I want you to understand
[08:28] that the volume confirmation is not optional. It is the ultimate safety net of this entire strategy. A new Zig Zag leg without a massive volume spike is nothing but a trap. The rules exist to protect your capital from
[08:41] aggressive trends exactly like this one. Take this as an invaluable lesson to check, and wait for the perfect alignment. Let's bounce back from that loss and look at a textbook setup that
[08:54] perfectly aligns with every single one of our rules. Notice how the market has aggressively pushed upward, forcing the Zig Zag indicator to lock in a sharp, brand new high leg. If you were trading purely on price action, you might look
[09:08] bullish breakout. But let's consult our ultimate filter, the volume indicator. Look down at the volume bar on that exact breakout candle. It is a massive green spike that completely towers over
[09:21] breaks through the middle moving average line. This is the unmistakable fingerprint of buying exhaustion. All the retail buyers rushed in at once, but Recognizing that the buyers have completely emptied their tanks, I
[09:36] confidently enter a 2-minute sell trade right at the close of that candle. Now, let's watch the market's immediate reaction. Almost instantly, we see a strong red candle begin to form, proving that the buyers indeed had absolutely
[09:49] nothing left to give. The sellers are now stepping in to capitalize on that exhaustion, driving the price down and away from our entry level. This sequence right here is exactly why we use a strict 2-minute expiration. It
[10:02] confirm the reversal and build a safety cushion for our position, but not so much time that a secondary trend has the chance to develop against us. We are simply dropping in, catching the immediate momentum shift, and getting
[10:16] out. As the timer runs out, the market holds its downward pressure and the trade closes beautifully as a clear, stress-free win. Now, look over at the trade history panel for this session. You can see a highly consistent string
[10:30] of successful executions using this exact method sitting right alongside that one loss we broke down earlier. This is the reality of trading. It is never about having a magical strategy that wins every single time. It is about
[10:43] having a strict, mechanical edge over the market and executing your rules flawlessly without letting your emotions take the wheel. If you are tired of disciplined, logical approach to your charts, make sure you hit that subscribe
[10:57] button and turn on notifications right now. Don't forget to download the free cheat sheet in the description. Practice this heavily on your demo account until the rules become second nature and never risk money you cannot afford to lose.
[11:10] disciplined, and I will see you in the next video.




⚡ Saved you 0h 11m reading this? Transcribe any YouTube video for free — no signup needed.