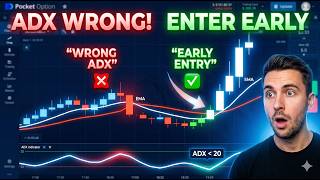

Why ADX >25 is TOO LATE on 1-Minute Charts
44sChallenges a common trading belief with a counterintuitive insight, sparking curiosity and debate.
▶ Play Clip"Delivers on the promise of a specific ADX strategy with clear rules and live examples, though the 'you're using it wrong' hook is somewhat overstated."
This video challenges the conventional use of the ADX indicator, arguing that waiting for ADX to confirm a strong trend on a 1-minute chart often results in entering trades too late. The presenter introduces an 'ADX Power Cross Strategy' for Pocket Option that uses ADX to identify trend exhaustion rather than strength, aiming to catch moves at their inception. The strategy combines two EMAs (5 and 13) with an ADX filter below 20 at the moment of an EMA cross, and the video includes live trade examples, including a loss, to illustrate the approach.
Most traders use ADX to confirm strong trends, waiting for it to cross above 25 or 30. On a 1-minute chart, this is often too late—the move is already 70% done, leading to entries near reversals.
The 'ADX Power Cross Strategy' flips conventional logic by using ADX to find trend exhaustion, not strength. The goal is to position at the birth of a new move, not the funeral of the last one.
The setup requires only three indicators: a 5-period EMA (white, fast line), a 13-period EMA (red, slow line), and the ADX with default period 14. The 20-level mark on the ADX panel is the foundation of the strategy.
The setup is an EMA cross (5 above 13 for buy, below for sell). The trigger is the ADX filter: ADX must be below 20 at the exact moment of the cross. If ADX is above 20, no trade is taken.
ADX below 20 indicates no strong directional momentum—the previous trend has exhausted. Entering on an EMA cross in this quiet zone positions you at the start of a new move, unlike entering at ADX 35-40 where trends are mature and reversal risk is high.
A buy setup showed the 5 EMA crossing above the 13 EMA with ADX below 20. The trade entered at the origin of a new cycle, and the widening EMA gap confirmed momentum, resulting in a clean payout at 1-minute expiry.
A sell setup had the 5 EMA crossing below the 13 EMA with ADX below 20, but a false breakdown occurred. A bullish candle pushed price up, and the trade closed out of the money. This highlights that no strategy has a 100% strike rate.
The presenter emphasizes that professionals accept statistical losses, protect capital, and avoid revenge trading. The ADX edge works over a series of trades, but market noise will produce false signals.
The ADX Power Cross Strategy offers a disciplined, rule-based approach to trading 1-minute charts by using ADX to identify trend exhaustion rather than strength. While it provides a mathematical edge, traders must accept occasional losses and maintain strict discipline to succeed.
What is the common mistake traders make with the ADX indicator on a 1-minute chart?
They wait for ADX to cross above 25 or 30 to confirm a strong trend, but by then the move is already 70% done, leading to late entries and reversals.
00:02
What is the core idea of the ADX Power Cross Strategy?
Use ADX to find trend exhaustion rather than strength, positioning at the birth of a new move instead of the funeral of the last one.
00:32
What three indicators are required for the ADX Power Cross Strategy?
A 5-period EMA (white), a 13-period EMA (red), and the ADX with default period 14.
01:13
What is the ADX filter rule for entering a trade?
The ADX must be below 20 at the exact moment of the EMA cross. If it is above 20, no trade is taken.
02:37
Why does an ADX reading below 20 indicate a good entry opportunity?
It means the market has no strong directional momentum, the previous trend is exhausted, and the EMA cross positions you at the start of a new structural move.
02:54
What happened in the losing sell trade example?
A false breakdown occurred: after the EMA cross with ADX below 20, a bullish candle pushed price up, and the trade closed out of the money.
06:11
What is the professional approach to losses in this strategy?
Accept statistical losses, protect capital, and wait for the next valid setup without revenge trading.
07:33
ADX Misuse on 1-Minute Charts
Highlights a common retail trader error that leads to late entries and losses.
00:02Flipping ADX Logic to Find Exhaustion
Introduces a contrarian approach that could improve entry timing.
00:32Rationale for ADX Below 20
Explains the market condition that makes the strategy effective, not just the rule.
02:54False Breakdown Example
Provides a realistic loss case, emphasizing that no strategy is foolproof.
06:11Professional Loss Management
Stresses the importance of discipline and capital protection over chasing wins.
07:33[00:02] Here is a question most retail traders never ask. What if you have been using the ADX indicator completely wrong? Most people use it to confirm a strong trend. They wait for the ADX to cross above 25 or 30, then they enter. The problem with
[00:17] that on a 1-minute chart is simple. By the time ADX tells you the trend is strong, the move is already 70% done. You enter, the momentum dies, and you get caught in the reversal, wondering what went wrong.
[00:32] Today, we are flipping that logic completely. This is the ADX Power Cross Strategy for Pocket Option. And instead of using ADX to find strength, we are going to use it to find exhaustion. I'm going to show you exactly how to
[00:46] identify the moment a previous trend has died, so you can position yourself right at the birth of the next move, not the funeral of the last one. Let's get into it. Quick, but important note. Binary options trading carries real financial
[00:59] risk. Everything in this video is for educational purposes only. If you are new to this, please start on a demo account and build your confidence there before touching real money. Now, let's get into the chart setup.
[01:13] To run this strategy, you need three things on your chart. Two EMAs and the ADX. That is it. No cluttered indicators, no confusion. Start with your exponential moving averages. Add the first EMA with a period of five and
[01:27] set the color to white. This is your fast line. It reacts quickly to price movement. Then add a second EMA with a period of 13 and set that color to red. This is your slow line. It represents the broader directional bias. Now add
[01:42] the average directional index. Keep the period at the default 14. You do not need to change anything here except one thing. Pay close attention to the 20 level mark on the ADX panel. That line is the entire foundation of this
[01:56] strategy. Once those three are on your chart, you are ready to trade. Let me walk you through the exact mechanical rules. There are two components, the setup and the trigger. And both must be present before you enter a trade. The
[02:09] present before you enter a trade. The setup is the EMA cross. When the five EMA crosses above the 13 EMA, that signals a potential buy. When the five EMA crosses below the 13 EMA, that signals a potential sell. The cross
[02:24] tells you direction, but direction alone is not enough. This is where most traders stop, and this is where most traders lose. The trigger is the ADX filter. At the exact moment of that EMA
[02:37] cross, you look down at your ADX line. The rule is strict. The ADX must be below 20 at the time of the cross. If it is above 20, you do not enter. You wait reasoning, and this is important to understand, not just memorize. An ADX
[02:54] reading below 20 means the market currently has no strong directional momentum. The previous trend, whatever it was, has run out of energy. The market is in a quiet, compressed state. When the EMAs cross inside that quiet
[03:08] zone, you are not chasing a move that already happened. You are positioning yourself at the very beginning of a new structural move as momentum starts to build from near zero. Compare that to entering when ADX is at 35 or 40. At
[03:23] that reading, a trend has already been running hard. It is mature. The risk of a sudden pullback or reversal is significantly higher. We skip those setups entirely, not because they can never work, but because the
[03:35] risk-to-reward profile is not in our favor on a 1-minute chart. To summarize the rules clearly, for a buy entry, the five EMA crosses above buy entry, the five EMA crosses above the 13 EMA, and at that moment, the ADX
[03:50] is below 20. For a sell entry, the five EMA crosses below the 13 EMA, and at that moment, the ADX is below 20. If either condition is missing, there is no trade. Before we get into the live chart examples, I have
[04:06] put together a free PDF guide covering everything we just went over. Buy setup, sell setup, indicator configuration, and the entry checklist all in one clean reference sheet. The link is in the description. Download it, keep it open
[04:20] while you practice, and use it until these rules are automatic. Now, I'm not going to tell you this wins every single trade. No strategy does. What I will show you is exactly how I use this live, wins and losses,
[04:34] so you can judge for yourself. Let's look at the actual trades. All right, let's break down exactly what happened on this setup. If you look at execution, you can see our exact mechanical rules aligning perfectly. The
[04:49] fast white five EMA has just sharply crossed above the slow red 13 EMA, giving us our upward directional bias. But the crucial detail is the filter. At the exact time of this cross, the ADX is resting quietly below the 20 level. This
[05:06] tells us objectively that the previous downward structure is completely exhausted. There is no residual bearish momentum left in the market. Because we are catching this right at the origin point of a potential new cycle, I
[05:19] executed a 1-minute buy order. Now, watching the trade progress is where many retail traders lose their discipline, but a mechanical system 1-minute candle opens, you can see the
[05:31] profit territory. Notice how the white EMA is now aggressively separating from the red EMA. This widening gap confirms that our new structural move is actually gaining strength. Because we entered based on
[05:45] exhaustion rather than waiting for a late momentum signal, we aren't fighting a choppy pullback. We are simply riding the clean initial wave of volume stepping into the market. There is no need to panic during the countdown. We
[05:58] just let the mathematical edge play out. And here is the final closure of the trade. The 1-minute expiry completes, and the candle closes significantly above our entry point, securing a clean, low-stress payout. All right, let's look
[06:11] at the other side of the coin with this setup on the chart. I mentioned earlier is the one. Looking at the chart, the mechanical rules dictated a sell. The fast white five EMA crossed down through
[06:24] the slow red 13 EMA. Checking our filter at the bottom, the ADX line was resting below the 20 level, signaling that the prior momentum was exhausted. Because the system flashed a valid signal, I kept my bias out of it and executed the
[06:38] 1-minute sell order exactly as the rules require. However, as the trade develops, you can see the market dynamics shift instantly. Instead of the anticipated downward break following the EMA cross, structural liquidity is swept and buyers
[06:53] aggressively step back in. A strong bullish candle forms, pushing the price straight up and completely against our entry point. If you look closely at the moving averages, you can see the white EMA immediately begin to
[07:06] flatten out and hook back upwards. This is the real-time anatomy of a false breakdown. On a 1-minute time frame, this kind of sudden volume injection happens, and the momentum shifts before the indicator can recalculate. The
[07:19] expiry timer completes, and the trade closes out of the money for a strict loss. I specifically included this raw footage because it highlights a crucial reality of technical trading. No indicator matrix, no matter how logical,
[07:33] indicator matrix, no matter how logical, possesses a 100% strike rate. The ADX mathematical edge over a series of trades, but market noise will inevitably produce false signals like this one. The difference between an amateur and a
[07:47] professional is that the professional accepts the statistical loss, protects their capital, and waits for the next valid setup without revenge trading. If you value this kind of transparent, strictly objective approach to market
[08:00] analysis, hit the subscribe button right now. Do not forget to download the free PDF guide in the description, study the parameters, and test this extensively on a demo account first. Stay disciplined, and I will see you in the next technical
[08:14] and I will see you in the next technical breakdown.




⚡ Saved you 0h 08m reading this? Transcribe any YouTube video for free — no signup needed.