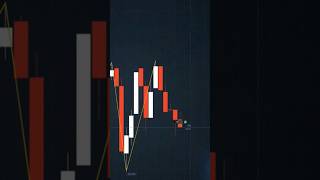

ZigZag Indicator: The Secret to Perfect Entries
40sReveals a simple, visual trading setup that promises clear buy signals, appealing to beginners seeking easy wins.
▶ Play Clip"The title promises a dramatic trade reveal, but the video is a basic strategy tutorial — solid but not the 'watch what happened' payoff implied."
This video presents a short-term trading strategy using the ZigZag indicator on a 1-minute expiry. It explains how to identify buy and sell signals based on zigzag confirmations and strong candlestick patterns, along with two key risk management rules.
Set your time frame to 30 seconds, add the ZigZag indicator with default settings. It confirms past price action, not future predictions.
Look for the zigzag below candles (price locked a low) followed by one or two strong bullish candles (solid body, close near top, no long upper wick). Enter with a 1-minute expiry.
Mirror of buy: zigzag above candles (price rejected a swing high), then one or two strong bearish candles (solid body, close near bottom, no long lower wick). Same 1-minute expiry.
Only take trades in the direction of an aggressive trend. Fighting the trend is the fastest way to drain your balance and a common beginner mistake.
High-impact news causes sharp spikes that the zigzag can't handle. Check the economic calendar and close charts during big events to protect your account.
The European and New York sessions offer high volume and reliable signals. Avoid early morning low-volume hours that produce choppy, false signals.
The strategy relies on zigzag confirmation plus strong candles, filtered by trend direction and news avoidance, and is best executed during high-volume sessions for reliability.
What time frame is recommended for this ZigZag strategy?
30 seconds.
00:01
What does the ZigZag indicator confirm?
It confirms what price has already done, not where it's going next.
00:15
What are the two conditions for a buy setup?
Zigzag below candles (price locked a low) and one or two strong bullish candles with solid bodies closing near the top and no long upper wick.
00:28
What is the sell setup mirror?
Zigzag above candles (price rejected a swing high) and one or two strong bearish candles with solid bodies closing near the bottom and no long lower wick.
01:08
What is rule number one for protecting your account?
Never trade against a strong trend; only take trades in the direction of the trend.
01:37
Why should you avoid trading during major news events?
High-impact news creates sharp spikes that the zigzag cannot handle cleanly.
02:05
Which trading sessions are best for this strategy?
The European and New York sessions.
02:18
Zigzag Confirms, Doesn't Predict
Clarifies the indicator's role, preventing misuse and setting realistic expectations.
00:15Trend Filter
A simple rule that dramatically reduces losses by avoiding counter-trend trades.
01:37News Avoidance
Highlights a common pitfall and a practical safeguard for account preservation.
02:05Session Timing
Emphasizes that market conditions affect signal reliability, a key factor for consistency.
02:18[00:01] your time frame to 30 seconds. Now, go to the indicator section, search for zigzag, and add it with the default settings. Don't touch anything. The default values are already well-suited for short-term price action. Once added,
[00:15] you'll see the zigzag lines connecting the recent highs and lows of price important to understand about this indicator. Zigzag doesn't predict where price is going next. It confirms what price has already done. That
[00:28] confirmation is exactly what makes it powerful for our entries. Now, let's talk about the buy setup. You're looking for two things happening together. First, the zigzag indicator is sitting below the candles, meaning price has
[00:40] and the indicator has locked in that point. Second, right after that confirmation, you see one or two strong bullish candles forming. Strong means a large, solid body closing near the top of the candle with no long upper wick.
[00:54] When both of those line up at the same time, that's your buy entry with a 1-minute expiry. Look at this example on the chart right here. Zigzag is below, two clean green candles follow. That's the setup, simple and clear. The sell
[01:08] setup is the exact mirror of that. This time, the zigzag indicator is positioned above the candles, meaning price has just rejected from a recent swing high. Then, one or two strong bearish candles form with solid bodies closing near the
[01:22] bottom. No long lower wicks. That's your sell signal, same 1-minute expiry. See this example here. Zigzag above, strong red candles follow right after. Perfect textbook setup. Now, let's talk about the two rules that will protect your
[01:37] account and make this strategy actually work long-term. Rule number one, never trade against a strong trend. If the market is aggressively pushing in one direction, you only take trades in that same direction. Fighting a strong trend
[01:52] back-to-back is the fastest way to drain your balance, and it's the mistake most beginners make repeatedly. Rule number two, stay out during major news events. High impact news creates sudden sharp spikes that the zigzag simply cannot
[02:05] handle cleanly. Before you start any trading session, check your economic calendar. If a big event is approaching, close your charts and wait it out. Patience here saves your account. Just these two filters alone will cut out the
[02:18] thing before we get to the live examples. Timing matters with this strategy. The European session and the New York session are where this setup performs best. Volume is high, price moves with purpose, and the zigzag
[02:31] reliable. During early morning low volume hours, you'll often see choppy sideways movement that generates false signals, movement that generates false signals, so avoid those windows entirely.




⚡ Saved you 0h 02m reading this? Transcribe any YouTube video for free — no signup needed.