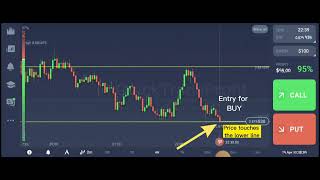

No-Indicator Strategy: 2 Lines = Easy Trades
45sThe promise of a simple, indicator-free strategy is highly appealing to beginners looking for quick wins.
▶ Play Clip"The title promises a 'free trading strategy' but delivers a basic support/resistance method with minimal depth and a heavy push to subscribe."
This video presents a simple trading strategy for IQ Option that relies solely on horizontal support and resistance lines, eliminating the need for indicators. The creator demonstrates the method on the Euro/GBP market using a mobile phone, emphasizing its simplicity and ease of execution.
Uses two horizontal lines to mark support and resistance levels instead of indicators. The strategy is presented as easy to follow.
On a 5-minute candle chart, place a horizontal line at the recent swing high (wick of previous green candle) for resistance, and another at the recent swing low (wick of previous red candle) for support.
Switch to a 2-minute (or 1-minute) chart for entry. The rule: buy when price touches the upper line, sell when it touches the lower line. No other indicators or analysis needed.
Wait for price to reach the marked levels, then enter the trade. The video fast-forwards to show the process in action.
The strategy is a straightforward, indicator-free approach to trading on IQ Option, based on identifying key support and resistance levels and executing trades when price touches them. It is designed for quick, simple trades on a mobile device.
What is the core rule of this trading strategy?
Buy when price touches the upper line (resistance) and sell when price touches the lower line (support).
01:18
What time frame is used to mark the levels?
5-minute candle chart.
00:21
What does the swing high represent?
The wick of the previous green candle, used to identify resistance.
00:34
What does the swing low represent?
The wick of the previous red candle, used to identify support.
00:49
What chart time frame is recommended for entry?
2-minute or 1-minute chart.
01:04
Indicator-Free Approach
Highlights a simple, accessible strategy for beginners who want to avoid complex indicators.
00:05Simple Entry Rule
Provides a clear, actionable rule that is easy to memorize and apply.
01:18[00:05] without using indicators instead we'll use two horizontal lines to Mark our levels this strategy is easy to follow so pay close attention I am currently trading on the Euro GBP Market using IQ option I use my cell phone to monitor
[00:21] the market and execute my trades first go to the 5 minute candle and we will Mark our levels using horizontal lines to do this click on the horizontal
[00:34] line tool and choose a color that is visible on your chart now let's place our first horizontal line at the recent swing High which is the week of the previous green candle this will help us identify a key level
[00:49] of resistance next we'll place our second horizontal line at the recent swing low which is the week of the previous red candle this will help us identify a key level of support
[01:04] I'm going to place hundred dollars for this trade now that we've marked our levels let's switch to a two minute candle for our entry this will give us a closer look at Price action and help us identify the
[01:18] best entry point remember to change the time frame to one minute here's the rule to remember and follow shell when the price touches the upper line and by when the price touches the Lower Lane
[01:33] our story is that simple we don't need any complicated indicators or over analyzing all we have to do is wait for the brush to reach our Mark levels and this is my second trade for the day using this strategy if you're curious
[01:48] about my first trade and how the strategy has worked for me feel free to check out my other videos alright let's fast forward this video and keep an eye on the price if it reaches our Mark levels it's time to
[02:03] take action and enter the market according to our strategy
[02:18] while we wait for the entry don't forget to subscribe to my channel I regularly make videos on easy and simple trading strategies that can help you make quick profits [Music]
[02:38] [Music] thank you
⚡ Saved you 0h 03m reading this? Transcribe any YouTube video for free — no signup needed.