
No 100% Winning Strategy Exists
44sDebunks a common myth in trading, sparking curiosity and engagement from viewers seeking realistic advice.
▶ Play Clip"The title accurately promises three simple strategies, and the video delivers exactly that with clear explanations."
The video presents three straightforward trading strategies based on price action that require only basic knowledge to implement profitably. The presenter emphasizes that no strategy is 100% effective and that risk acceptance is crucial before trading.
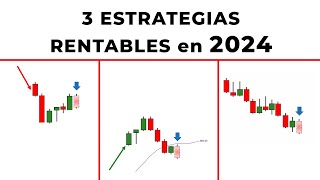
The video shares three simple and effective strategies for profitability in 2024, requiring only basic trading knowledge.
No strategy is 100% effective; risk is always involved. If you cannot accept the risk, do not trade.
The goal is to minimize losses, not win every trade. Trade with amounts that do not cause emotional pain.
Use a demo account as if it were real to gain experience and filter trades better.
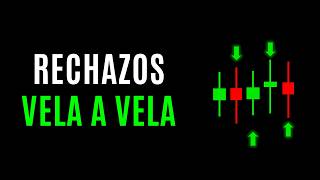
Count repetitions of a candlestick pattern (e.g., bullish then bearish). Trade from the fourth repetition onward for higher probability.
Trade in the direction of the trend and with support/resistance levels to increase success probability.
Identify a large candlestick containing smaller ones. Use its open as resistance and close as support. Trade with the trend.
Better if the master candlestick has more than three candles inside. Wait for price to touch support (in uptrend) or resistance (in downtrend).
Identify a strong reversal that breaks the 20 EMA. Wait for a weak pullback candle that does not break back through the EMA, then trade the continuation.
The pullback candle must not break the 20 EMA; otherwise, probability of success decreases.
The three strategies—candlestick counting, master candlestick support/resistance, and 20-period EMA breakout—are simple yet effective when combined with price action and proper risk management. Practice and continuous study are essential for success.
What is the main risk warning given before presenting the strategies?
No strategy is 100% effective; there is always risk involved. If you cannot accept the risk, do not trade.
00:29
What is the recommended number of repetitions to trade in the candlestick counting strategy?
Trade from the fourth repetition onward for higher probability of success.
06:54
What defines a master candlestick?
A large candlestick that contains several smaller candlesticks inside it.
12:19
In the master candlestick strategy, what do the open and close represent?
The open is resistance, and the close is support.
13:02
What condition must the pullback candle meet in the 20-period EMA breakout strategy?
The pullback candle must be weak and not break back through the 20-period EMA.
28:32
Why is it important to trade with amounts that do not cause emotional pain?
To avoid making irrational decisions due to fear or greed, and to maintain discipline.
01:37
What is the purpose of using a demo account?
To practice and gain experience as if it were a real account, improving trade filtering.
02:05
How can you increase the effectiveness of the candlestick counting strategy?
Trade in the direction of the trend and with the help of support and resistance levels.
06:54
What should you do if the pullback candle in the EMA breakout strategy breaks the EMA?
Do not take the trade, as the probability of success decreases considerably.
28:46
What is the goal of trading according to the video?
To reduce losses as much as possible, not to win every trade.
01:23
No 100% Effective Strategies
Sets realistic expectations and emphasizes risk management as foundational.
00:29Candlestick Counting Strategy
A simple yet effective pattern recognition technique for trading.
04:31Master Candlestick Strategy
Uses large candles to define key support/resistance levels for trend trading.
12:1920-Period EMA Breakout Strategy
A momentum-based strategy that capitalizes on strong breakouts with pullbacks.
21:50Pullback Candle Must Not Break EMA
Critical rule that filters out false breakouts and improves success rate.
28:32[00:01] Hello traders, welcome to a new video. This time, I want to share video. This time, I want to share with you three simple and effective strategies that you can follow to be profitable this year. To follow
[00:15] these strategies, you don't need advanced trading knowledge; some basic knowledge is enough for you to start profiting from the market. Before continuing, I want to mention the warnings and
[00:29] risks so that you don't have false expectations about these or any other strategies. First, let's say that there are no 100% effective or guaranteed strategies. It's common for people to ask me
[00:44] a strategy that never makes you lose, and so on. Well, you need to know that this does n't exist. In reality, there are no 100% effective trading strategies.
[00:56] There is always a risk involved. And if you don't accept that risk, then simply don't trade. For example, if I'm going to take a 5-unit trade but I can't
[01:08] accept that the trade goes wrong and I lose those 5, then it means I 'm not accepting the risk. Therefore, it's best not to trade. This is very important to pay attention to because it's not about winning every time.
[01:23] Since, as we've said, it's impossible to have 100% effective strategies, our goal is to reduce losses as much as possible. If we're already trading with real money, it's important to start with amounts that don't cause us
[01:37] pain. What does this mean? For example, if I'm going to trade with $10, but losing that $10 causes me a lot of sadness, anger, and despair—in short, it's causing me pain—then it means that amount is too high, and it's
[01:52] best to reduce it. For example, if I take trades of $ and lose, and it doesn't cause me pain, despair, or sadness, it means I'm trading with appropriate amounts and should continue trading that way.
[02:05] If we're not yet trading with real money because we don't have enough experience or the necessary capital, then let's practice on a demo account. It's important to use the demo account as if it were a
[02:17] real account so that it's useful. That way, we get the most out of the demo. The more you practice, obviously, the better you'll filter your trades. This means that the more experience you have, the more effective
[02:31] your trades will be. As I said before, these strategies aren't infallible. Nor are they simple; that is, it's not like you have to sit there waiting for two lines to intersect or for an arrow to appear on the screen—something that
[02:44] simple. Generally, that doesn't work because the market will always have a degree of difficulty. Despite that, these three strategies I'm sharing with you are the easiest to implement and offer good
[02:59] results. It's a balance between good results and easy-to- implement strategies because they don't require too many rules, and we can start beginning of trading. Therefore, if you do n't have any strategies, I
[03:12] recommend you give these three a chance and test them for necessary time to get used to these strategies so you can have a large number of samples to determine if the
[03:25] strategy is profitable or not. The more knowledge you have about price action, obviously, the better you'll be able to implement these strategies, and the more effective they will be. So, I encourage you to keep
[03:38] studying. If you're going to implement these strategies and they're giving you good results, then keep studying; that way you'll get even better results. And remember that you They are free to use these three
[03:51] strategies or they can also combine them with other strategies. For example, some traders already have two other strategies, and with these three, they would now have a repertoire of five strategies. They can also choose to
[04:03] use only one strategy; there's no problem with that. Some traders only use one strategy and take one or two trades each day. It's also possible to be profitable with that, so it depends on each trader. Let's not forget that
[04:16] each trader has their own trading style. So the most important thing is that each person feels comfortable with their way of trading. Well, having given the warnings and the risks, let's move on to the first strategy. The first strategy
[04:31] is a classic, something we've used here on the channel since the beginning, and it's the classic strategy of candlestick counting. I know it's a fairly basic, quite simple strategy, but it's actually quite effective.
[04:46] If we pay attention to what the market is showing us, we can make good profits from this strategy. Candlestick counting basically consists of counting the number of times a pattern repeats. To understand it better, let's explain
[05:01] the rules. The rule is that the counted candlesticks must have similar characteristics. What do we mean by counted candlesticks? Let me show you, for example, here we see a bearish movement. Within that bearish movement, we see
[05:16] a green candle, and after that green candle, there's a red candle, another bearish candle. Then we have another green candle, a bullish candle, followed by a bearish candle. And then it repeats itself: a bullish candle followed by a
[05:31] bearish candle. So here we have a repetitive structure. It has repeated itself once, twice, and three times. Because it has repeated itself three times, we can trade it a fourth time. So, to increase the probability of success with
[05:45] this strategy, we can trade it from the fourth count onward. As I've said, here we already have one count, two counts, and three counts, and here a bullish candle repeats. This means there's a probability of another
[06:00] structure will repeat. So we can sell on this next candle, hoping it will also be bearish. Generally, we can use this strategy from the third count onward. What does this mean? If we have the structure once, twice, we
[06:14] can trade it a third time. However, if we trade it a third time, it might It has a low probability of success. So it's not that certain; it's a little safer, not by much, but a bit safer. If we trade a
[06:28] fourth time, in this case, the fourth time has a slightly higher probability of success, and if there were a fifth or sixth time, they also have a probability of success. However, the more times the candlestick count is repeated, for
[06:41] example, a sixth time and then a seventh time, the probability of success will decrease. We have to assume the risk. Therefore, I recommend that if you want to maintain a good probability of success, trade it at
[06:54] least once, starting from the fourth count. And it's much better if you can trade it in the direction of the trend and with the help of price action. What does that mean? It means it's much better if the count shows you a
[07:08] selling opportunity in a downtrend, and, for example, if we had good support and resistance levels to support us in taking that trade, this would greatly increase the probability of success. Now I'm going to show you some examples. Here we
[07:22] going to show you some examples. Here we start with the classic structure. If we notice, well, all of this... It appears to be a bearish trend, and a bearish candlestick is forming, followed by a bullish one.
[07:35] followed by a bullish one. notice that the counted candlesticks have similar characteristics. If you look at this bearish candlestick, it's weak because it has a long wick at the bottom. This candlestick is
[07:48] also weak, with a long wick at the bottom. This has a very small body and a long wick at the top. We have the structure that has been repeated three times. We have the third count. Now another
[08:02] third count. Now another bearish candlestick with a small body is forming. This means that this fourth candlestick in the count is similar to the previous three. Therefore, the candlestick count will repeat itself, and we can
[08:15] take a buy position on this next candlestick, hoping that the structure will repeat itself— that after a bearish candlestick, there will be a bullish one. And so we can take our buy position here. Even if we look further ahead, we have another weak bearish candlestick, which
[08:30] means we can still continue with the count. And we can buy on the next one. In this case, we would be buying on the fifth candle count. If we notice, after the fifth count, we have a sixth count, but this
[08:43] candle is very large. This one breaks the structure of the previous candles. The previous ones are weak and have a long wick and a small body.
[08:55] few wicks; the opposite. The structure has been broken because the characteristics of the candles are now different. So we are no longer complying with the rules. Because of this, we do n't buy on this next candle.
[09:08] So here we have a clear example of what a basic candle count would be. Here we can see another example of a candle count. We can observe that we have a bullish candle and then immediately a bearish one. Bullish, bearish, bullish,
[09:22] bearish. The count has been repeated three times. We can take advantage of it a fourth time. Here we have a fourth bullish candle, and we can take advantage by selling here on this candle. We would be selling, hoping
[09:36] that the structure remains bearish and that it will favor us. In this case, we can also... Taking advantage of the support and resistance we have, this gives us a higher probability of success if we sell on this candlestick.
[09:49] Sometimes the candlesticks won't necessarily be the same. For example, here we have a long wick at the bottom, here we have less wick, and here even less has a larger body, this one has a slightly smaller body, but this one is
[10:02] definitely smaller than the other two. At first glance, we can say that the structure of these candlesticks is different; they don't have similarities. However, we also have to pay attention to the fact that they are still
[10:15] weak candlesticks because they can't break the high of the previous candlesticks. This means that sellers have continued to dominate, even though the candlesticks are bullish. Sellers immediately dominate, and that's
[10:27] price action that favors us. For that reason, we could sell on this next candlestick. Here we have another example within an uptrend: we have a weak bearish candlestick, the next one is bullish (first count), a weak bearish candlestick,
[10:41] and the next one is bullish ( second count), a bearish candlestick that isn't so weak because it's closing near its low, but it has too much wick. So, the wick again isn't a candle that represents much strength, and the
[10:54] the structure is repeating three times. We have the third count. And again, We have the third count. And again, a weak bearish candle repeats. So, here we have the fourth count, which means we can buy on the next candle.
[11:07] So, here we can also apply the strategy. We would be using a support, which would be this support here of the micro range, and we would be trading in favor of a new upward trend. So, we also have price action in
[11:20] our favor. We would be taking advantage of the fourth opportunity. If we notice, weak. So, it would still be valid to look for a buy. Some of us this next candle. But if, for some reason, we managed to grab a good
[11:35] entry point, it would still be profitable. That's what I'm saying; it's much more favorable to trade the fourth count. Okay, let's leave the examples I want to dedicate a special video to this strategy, explaining in
[11:51] more detail how we can increase its effectiveness if we use price action in our favor and what things we should... To avoid making mistakes, uploading a video explaining this candlestick counting strategy in more detail.
[12:06] If you want examples, you know I've already shared many, many examples in my sessions that are uploaded here on the channel, since I usually trade this strategy quite a lot. Let's move on to strategy number two. And here
[12:19] we're going to see what the support and resistance levels of the master candlestick would be. Last year, in 2023, I was trading this strategy quite a bit, so I also benefit from it. I know you've seen me trade it in my
[12:34] routine sessions. The rules are simple. First, we must identify a master candlestick. We know that a master candlestick is a large candlestick that contains several other candlesticks inside. In this case, for example,
[12:47] this candlestick contains 1, 2, or 3 other candlesticks inside. So basically, that would be a master candlestick: a candlestick that has smaller candlesticks inside. I already have a video explaining the master candlestick in detail. Second, we have
[13:02] of the master candlestick. That's also explained in that lesson, but here I'll tell you quickly: in this case, the opening of the The candlestick would be the resistance, and the candlestick's close would be the support. So here we identify the support
[13:17] and resistance levels of the master candlestick. To increase our effectiveness using this strategy, we must trade with the trend. For example, here we are in a downtrend, and it's even better if the master candlestick has
[13:30] more than three candlesticks inside it. As I've said, we have here a large bearish candlestick that, after forming, leaves us with support and resistance. And within that support and resistance, it has one, two, or three candlesticks; in
[13:46] this case, it has four. So, even better. Here we have downtrend, that we have a master candlestick with support and resistance levels, and obviously, the master candlestick has more than
[13:58] three candlesticks inside it. So, having identified all that information, we wait for the price to reach the resistance and trade with the trend. That is, we trade a sell order, hoping that the next candlestick will be
[14:11] bearish. So, now I'm going to show you some examples. Here we are in a general uptrend. We can observe a lot of bullish strength. Suddenly, we have a pullback to the 20- period EMA, and again, strength. In
[14:25] this latest bullish impulse, we can observe this large bullish candlestick, a strong bullish candlestick much larger than the previous ones. So when we see that bullish candlestick form, we can draw its resistance and support. Okay,
[14:41] draw its resistance and support. Okay, obviously, since we're in an upward trend, what we want to do is buy. So we wait for the price to touch the support of the master candlestick, and here we
[14:54] have it. In these three candlesticks, the price drops until it touches the support of the master candlestick. So we could look for a buy in this next candlestick here, hoping that the price will react. In this case, we would use the support of a
[15:07] master candlestick. In some cases, it can be a little confusing because of the we try to go with a good entry point. Here we have an upward trend, and we can observe several master candlesticks. Here we have the first
[15:22] master candlestick, but if we notice, the price never touches the support, so we don't use it. Next, here we have another master candlestick. We can observe that two bearish candlesticks form inside it, so we could buy in
[15:36] this next candlestick. Obviously, here we would be buying in the third candlestick. That means... We are fully complying with this rule here, therefore the probability of success remains somewhat low. If we want to increase,
[15:49] we must wait for at least three candles within it. And of course, after this bullish candle, since it is suspect that the price will try to push again. So we could
[16:01] buy on this next candle, taking advantage of the fact that the master candle already has three candles within it. However, here our best master candle is this one here. This candle, if we notice, is not a strong candle, but it is
[16:14] a large candle because it has wicks on both sides. The support of the on both sides. The support of the master candle will be what would be the opening of the candle, and the resistance of the master candle will be the closing
[16:28] inside. To count the inside, we can apply the wicks. So inside we have a doji, a bearish candle, two bearish candles, three bearish candles. In this case, we already have four candles inside the master candle, with
[16:43] this last bearish candle being the one that touches the support area and rejects. Due to this reaction, it is valid. If we take a buy position on this next candle, we could try to grab the lowest possible entry point.
[16:56] In this case, we would have won. The operation is a bit confusing, perhaps because the candles are very weak, because they have too much of a wick. However, it is valid to trade it; it's much better if we go with a good entry point.
[17:08] Here I have shown you the example of cases where the price doesn't reach the support of the master candle, cases where it reaches it with few candles, and cases where it does reach it but the situation is a bit confusing because we have too much of a wick.
[17:21] In this case, if we see situations like this, it's best to simply leave it and wait for a new opportunity. If we already have more experiment and we can also take advantage of trading these situations
[17:34] since we can assume the risk of losing some trades. In this example, we see what would be another master candle in favor of a downtrend. We are in a downtrend with lower lows and higher highs. Here we can
[17:47] observe that this candle is a master candle because it is a candle with a good body, a large candle that has at least three candles inside. We have the resistance of the master candle and we have the support. From the master candle, so here we are
[18:00] in a downtrend. We can count a pullback of one, two, or three candles, and the third candle stops right at our resistance area. Because of this, we can look for a sell immediately on the next candle. In
[18:12] this case, we would also be using as support what would be the dynamic resistance, a kind of channel that has been forming, and the increasingly lower lows, plus the master candle, greatly increases the probability of
[18:25] sell. Remember that it's much better if we go with show you an example of a downtrend. And suddenly, a large bearish candle, larger than the previous ones. And if we draw what would be the
[18:40] resistance of that master candle more or less here, and we draw the realize that we can take some trades there. We simply wait for the price to fill that master candle and take us to the resistance. Since
[18:55] downtrend, we would have to sell, and to sell, we obviously The price has risen in these three candles, so it's already meeting all our rules. We could sell on the next candle.
[19:10] this candle, which ends up being a bullish candle. What happens here is that the price ends up filling this small space between the wick. This does n't always happen; it only happens a few times.
[19:24] latent risk. So, if we see that there's room for the price to fill, waiting until the price has filled that area. In this case, it fills it with this doji. The filling isn't very clear, but it's an
[19:38] additional candle that the price manages to make trying to fill it. If we don't take the trade and we see this doji, we could sell since we know that the buyers didn't have enough strength and couldn't break the
[19:50] we can sell on the next candle. If for some reason we sold before and lost on this candle, we can sell again, hoping that the price will actually react. Now, regarding the resistance of the master candle, here,
[20:05] either of the two actions... They are valid, but let's not forget that if we suspect the price might fill up, we should wait or try to grab the highest possible entry point to avoid getting trapped. Here we see
[20:18] another example, since the master candle won't always work. Here we are in a fairly strong uptrend, and we can identify a master candle. It's not the largest candle, so it's not a
[20:31] particularly suitable master candle; however, we can consider it, especially because we have one, two, four candles inside it. So here we could risk looking for a buy in this next candle. Here, as we
[20:43] see, it would have been lost. But it would be valid to look for that buy following the valid to look for that buy following the basic rules of the master candle. Now I want to explain that there is information here that helps us avoid
[20:55] making that mistake and losing the trade. First, we realize that the price in the second candle after the master candle drops and touches activated the buyers who were
[21:08] there, the buyers we wanted to use to our advantage. returns to that support, there is less probability that the buyers will react because they already reacted previously. Therefore, if you You're
[21:22] you manage to recognize this information, avoiding making this bad purchase and losing this trade. That's why I told you to keep studying price action; it can allow you to filter your trades much better. Well, if you
[21:37] want to see examples of how we trade this master candle, I've already shared several examples in the sessions on the channel, and I also hope to share new examples in the next videos. Now, to finish up, let's move on to
[21:50] strategy number three. This strategy can be a little more complicated than the previous two strategies; however, it's still valid and still has good effectiveness if we stick to the rules.
[22:03] Okay, so pay close attention. Among the rules, we have to identify a reversal or a strong pullback that breaks the 20-period EMA in a single move.
[22:15] We wait for a pullback candle to form towards the recently broken EMA, and if the pullback candle isn't very strong, we can trade the continuation of the breakout. Now, let me explain: this purple line we have is the 20-
[22:29] period EMA. We're in a strong uptrend where we haven't touched the 20-period EMA in several candles, at least. After about 7 or 10 candles, we suddenly have a very strong pullback that breaks the 20-period EMA. In this very strong pullback, we do
[22:45] n't see any bullish candles; we only see bearish strength. Here we are already fulfilling one of the rules: that we have a very strong reversal pullback and that the 20-period EMA is broken. After this break, we will
[22:58] wait for a pullback candle to form against the EMA, which would be this bullish candle we see here. The price breaks the EMA very strongly and rises in the next candle, but the next candle is very weak and fails to break above the 20-
[23:11] period EMA. Therefore, we confirm that it is only a pullback candle. So, in this case, the candle is not very strong, and we can trade the continuation of the breakout. This means that the price broke down below the 20-period EMA,
[23:25] retraces, and we can sell on the next candle, hoping that the price will continue pushing a little further down. Our objective here is to wait for at least one more bearish impulse. Obviously, this impulse may not
[23:38] go very far, and then the price It continues to rise, and since we are trading best thing to do is simply take advantage of an opportunity. And that opportunity would be right after the retracement candle. Now I'm going to show you
[23:53] an example. Here we have a downtrend where we can see that the price hasn't touched the 20- period EMA in several candles. Suddenly, we have a very strong upward move. We have candles with
[24:06] strong characteristics and several consecutive bullish candles. In this case, we would be seeing the strong retracement or reversal that breaks the 20-period EMA. The price is on the other side of the EMA. We expect a retracement candle;
[24:21] retraces after the break of the 20-period EMA. And since it's a weak candle because it doesn't manage to break the low of the previous candle, it means we can take a buy trade in
[24:33] favor of the new trend. In this case, it would be taking a buy position on this next candle, hoping that the price will rise for at least one more candle. Here on this side, I'll contexts aren't always going to be the same. For example, here the The price starts
[24:47] pushing very strongly, and here it begins very weakly, but suddenly it pushes a clean move, not a sort of healthy movement with alternating upward and downward movements. We expect it to be
[25:00] in this case, a strong one, followed by a bullish pullback candle that doesn't break above the 20-period EMA, as is happening in this case. The bullish candle is very weak; it doesn't break above the 20-
[25:14] period EMA. For this reason, we can take a sell position on the next candle. Here I upward trend where the price hasn't touched the EMA for more than seven or ten candles. And suddenly we have a very strong
[25:27] downward move, several bearish candles, and followed by a small upward move, a very weak candle that doesn't break above the 20- period EMA. So it's perfectly valid to look for a sell position on the next
[25:39] candle. On the other hand, I show you another example, and in This case is similar; we don't have an upward trend. The price has n't touched the 20-period EMA in more than 10 candles. And suddenly, we have a strong downward move. The move
[25:53] doesn't start out very strong; it begins with dojis, a micro-range, but then we have three very strong bearish candles. The fourth candle is a bullish candle, but it doesn't have much strength; it doesn't manage to break the 20-period EMA. Because of this,
[26:06] candle, hoping that the price will drop at least one more candle. In this case, it does; it drops one more candle and then continues rising, but we would take advantage of at least this candle here. So, these are other contexts in which
[26:19] we can take advantage of this 20-period EMA breakout strategy. There are other kinds of contexts where we can trade it as long as the price hasn't gone too far. For example, here we have an upward trend, and the
[26:32] price drops very sharply; it has a weak pullback and doesn't manage to break the 20-period EMA. So, it's valid for us to look for a sell order on the next candle, applying this strategy. Then, the price changes trend. And now it's going
[26:44] down. And suddenly it breaks the 20-period EMA very strongly, it has a pullback, and we could buy on this next candle, hoping it will have at least one more bullish candle. In this case, well, in this whole
[26:57] rough structure, we've found two opportunities to apply this 20-period EMA breakout strategy, but we have to avoid, for example, if this pullback/reversal goes very low, for example, to here where the other
[27:10] low is, and shows us a bullish candle here. In that case, we have to be changing structure and showing us more than one bullish candle, and in this case, we would be missing the opportunity. So we do n't want the price to have gone
[27:24] too far. If we're going to apply this strategy, there will be allow us to apply it very well. For example, here we can see a general bearish trend and a lot of
[27:36] bullish strength, and suddenly a very weak bearish candle. That means it is valid to look for a buy on the next candle. Under these conditions, the so here we would only have profited on this next one. Buy if we had
[27:50] taken a good entry point. So we always have to be cautious, entry points or simply assuming the risks. Here we can see price hasn't touched the 20- period EMA for quite some time, suddenly it
[28:06] rises, breaks the 20-period EMA, has a pullback, and we could buy on the weak, but even so, the trade could have been won if we had had a good entry point. So, as always, pay close attention to this
[28:19] price information and always try to go in with a good entry point, knowing that there are risks and that sometimes, even if we have a good entry point, the trade will be lost. It's okay;
[28:32] forget, trader, that it's very important that the pullback candle doesn't break the 20-period EMA. In this case, we have a very strong upward movement, we have the downward movement, which would be the strong reversal, and the next candle is
[28:46] the bullish candle. If we notice, the bullish candle manages to break the 20- means it's dangerous to take a sell position on the next candle, as the price could continue rising. In this case, the trade would have been profitable;
[29:00] but it won't always happen. As I've said, the probability of success decreases considerably. For example, here we can see that the price drops sharply to the 20-period EMA, leaving us with a bullish candle that could be a
[29:13] retracement, and then the price could continue pushing downwards. However, in this case, that doesn't happen; the price simply shoots up and continues pushing necessary that after the break of the 20-period EMA, the retracement doesn't manage to
[29:26] go back below that EMA in order to continue profiting from this new movement. Very well, traders, with this, we'll conclude these three simple and effective strategies. I hope they are useful so that
[29:41] you can profit from the market this year, and I also hope to develop each of these strategies much better with their respective market examples. Don't forget that I usually trade these
[29:54] strategies, and several videos of my sessions are already available here on the channel. By operating precisely these strategies of counting basic support and resistance candles, the master candle, or even the
[30:06] 20-period EMA breakout, you can check out the videos if you want and have the time. If you have any questions or suggestions, you can leave them in the comments. I'm signing off, traders. Have much success. Take care.
[30:21] Take care.
⚡ Saved you 0h 30m reading this? Transcribe any YouTube video for free — no signup needed.