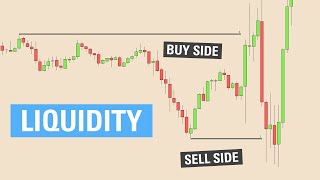

What is Liquidity in Trading?
40sClearly defines a core trading concept with visual examples, making it educational and shareable for beginners.
▶ Play Clip"Title accurately reflects content: a tutorial on identifying liquidity through examples."
This video explains the concept of liquidity in trading, focusing on where stop losses are placed at obvious highs and lows. Through multiple chart examples, the presenter demonstrates how to identify buy-side and sell-side liquidity and use them as targets for trade setups.
Liquidity is where people's stop losses are sitting, found at the most obvious highs and lows.
Buy-side liquidity rests above obvious highs (stops for shorts), sell-side liquidity rests below obvious lows (stops for longs).
Look for obvious highs and lows; equal highs/lows become targets. Once liquidity is taken, look for a setup.
The presenter prefers the 15-minute chart for easier identification of liquidity zones.
After running stops, zoom into 1-minute chart for a 2022 mentorship setup: short-term high, displacement, fair value gap, and Fibonacci discount.
Relative equal highs and lows become future targets. Structure shift confirms direction.
Identifying liquidity at obvious highs and lows is key to anticipating price movements. Using higher timeframes like 15-minute charts helps spot these zones, and specific setups like the 2022 mentorship can be applied after liquidity is taken.
What is liquidity in trading?
Where people's stop losses are sitting, found at obvious highs and lows.
00:08
Where is buy-side liquidity located?
Above obvious highs, where short sellers place their stops.
00:22
Where is sell-side liquidity located?
Below obvious lows, where long buyers place their stops.
00:22
What chart timeframe does the presenter prefer for identifying liquidity?
15-minute chart.
02:03
What is the 2022 mentorship setup?
After running stops, look for a short-term high, displacement, fair value gap, and Fibonacci discount on the 1-minute chart.
03:03
What are relative equal highs and lows used for?
They become future targets for liquidity runs.
04:00
Liquidity Defined
Core concept of the video: liquidity equals stop locations.
00:08Buy-Side vs Sell-Side
Clear distinction between where stops are placed for longs and shorts.
00:222022 Mentorship Setup
Specific actionable trading setup combining multiple concepts.
03:03Relative Equal Highs/Lows
Important pattern for predicting future liquidity targets.
04:00[00:08] a little bit longer than my other videos, and that's because the best way to teach this concept is just through a bunch of examples. So, let's get into it. All liquidity is is where people stops are sitting. That
[00:22] can be found at the most obvious highs and lows. For example, if we look on this chart, where are your most obvious highs and lows? Well, and right there. What is resting above this? Anyone who
[00:35] got short will put their stops up here to buy back their position. So, this is where your buy-side liquidity is. Anyone that got long in this area will have their stops under here to sell
[00:48] their position. Now, those are the most obvious ones, but you can also go down and look into here. So, if we're looking at for here. So, if we're looking at for sell-side here, what are we looking for?
[01:00] Well, we have an obvious low right here. So, what is resting under that? Sell-side liquidity. So, that is taken. Anyone that got long now, where would they put their stops? Either right here or right here.
[01:15] liquidity. Once those are taken, that's when you look for your setup. You see how this buy-side liquidity here is taken right So, can kind of get rid of that. But then you want to look back, right?
[01:31] What is right here that kind of lines up with there and there, right? We just with there and there, right? We just have a bunch of equal highs in here. that shorted up in this area or down here will have
[01:46] their stops up here. So, that becomes a target for us. There is liquidity in this area. And once it is taken, then you look for the short setup. This is on the 5-minute. I personally like to look on
[02:03] the 15-minute chart. I find it easier. As you can see here, it becomes a lot easier to see. So, we are on the 15-minute chart here. here. Where is your obvious liquidity?
[02:19] below here, right? So, as you notice, we're kind of range bound in here. So, how are you going to Well, let's say someone got long right here.
[02:33] the way down here? Probably not. They're going to put it right here. Same thing for people getting short in this area, right? So, you can kind of just draw out these obvious highs and lows.
[02:50] whole range of stops, right? So, for example here, let's say you're bullish. We run these stops right here. We run these stops here. This is where you would zoom in and look
[03:03] for your 2022 mentorship setup, right? So, if we go into the 1-minute chart here, this is where we ran those stops, right? So, anyone that got long selling their position in here, and we want to be
[03:16] this right here? Yes, but that's also more risky. So, what are we going to do? We want to look for a 2022 mentorship setup, right? look for a 2022 mentorship setup, right? We put in a short-term high here.
[03:31] We run that, get some displacement over it, and then we have a fair value gap right here, which I will just outline like this.
[03:45] drawing a fib from our displacement range, range, right? in a discount here. So, that is a valid setup. Just one more example here.
[04:00] setup. Just one more example here. We have this liquidity right here. And then this liquidity right there.
[04:12] Right? So, what does that mean? What happens when we put in relative equal highs and relative equal lows? They become targets for later. This one is Right? Get some structure shifting right here.
[04:26] This one becomes a target for later. You can see. want to target these relative equal lows. helpful. If it was, please let me know in the comments below. Thanks again for
[04:40] in the comments below. Thanks again for watching.
⚡ Saved you 0h 04m reading this? Transcribe any YouTube video for free — no signup needed.