What is the Power of Three?
45sClear introduction to a core trading concept, building curiosity for beginners and traders.
▶ Play Clip"Title accurately describes the content: a detailed tutorial on ICT's Power of Three with clear examples."
This video explains ICT's Power of Three (Accumulation, Manipulation, Distribution) trading concept, covering how to identify it on charts and use it for entries. The presenter also clarifies OHLC and OLHC candle structures and provides multiple chart examples.
The Power of Three (AMD) consists of Accumulation (range/consolidation), Manipulation (false breakout), and Distribution (expansion move).
Before using AMD, traders need higher timeframe order flow or draw on liquidity to avoid trading patterns without a narrative.
OHLC (open high low close) and OLHC (open low high close) refer to the structure of a higher timeframe candle, with intraday price action creating the range.
Accumulation creates buy stops above highs and sell stops below lows. Manipulation is a false breakout that stops out traders and induces breakout sellers. Distribution then moves price in the intended direction.
Two entry types: reversal entry within manipulation to catch the whole distribution, or continuation entry after manipulation if missed.
AMD is fractal and can be applied across all timeframes, from lower to higher.
Price consolidates, builds liquidity above high and below low. Manipulation sweeps the low, then price reverses back into range, signaling distribution higher.
On 5-minute chart, consolidation followed by manipulation that sweeps sell-side liquidity, then distribution to failure swings above.
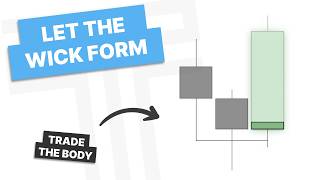
London session manipulates Asian range, creating the wick of the daily candle, then distribution higher through New York forms the body.
London consolidates (accumulation), then manipulates, leading to distribution higher into New York open.
After daily distribution, a new AMD forms on 1-minute chart: accumulation before New York open, manipulation down, then distribution lower.
Use manipulation leg projection (e.g., 2-2.5 and 4-4.5 standard deviations) to estimate distribution targets.
If struggling to find consolidation, focus on aggressive price action out and back into a range; then identify the range as accumulation.
London session shows aggressive move out and back in; identify accumulation range, project manipulation leg, and anticipate distribution lower.
The Power of Three (AMD) is a reliable framework for identifying intraday directional moves when combined with higher timeframe context. Entries can be taken either at the manipulation reversal or as a continuation within the distribution phase.
What does AMD stand for in ICT trading?
Accumulation, Manipulation, Distribution.
00:12
What is the purpose of accumulation in the Power of Three?
To create buy stops above old highs and sell stops below old lows.
01:17
What does manipulation do in the AMD cycle?
It is a false breakout outside the accumulation range that stops out traders and induces breakout sellers/buyers.
01:30
What are the two entry methods for trading the Power of Three?
Reversal entry within manipulation, or continuation entry after manipulation.
02:29
How can you project distribution targets?
By projecting the manipulation leg using standard deviations (e.g., 2-2.5 and 4-4.5).
10:04
What should you do if you struggle to find the consolidation range?
Focus on aggressive price action out and back into a range, then identify that range as accumulation.
11:39
Is the Power of Three fractal?
Yes, it can be used on any timeframe.
03:08
What is the difference between OHLC and OLHC?
OHLC is open high low close; OLHC is open low high close. They refer to the order of price action within a candle.
00:38
Higher Timeframe Context Required
Emphasizes that AMD should not be traded without a higher timeframe narrative, preventing pattern trading.
00:26AMD Cycle Explained
Clear breakdown of how accumulation builds liquidity, manipulation traps traders, and distribution captures the move.
01:17Two Entry Types
Provides practical entry strategies: reversal within manipulation or continuation after manipulation.
02:29Projecting Distribution with Standard Deviations
Introduces a quantitative method for setting profit targets using manipulation leg projection.
10:04Identifying Consolidation via Manipulation
Offers a practical tip for traders who struggle to spot accumulation ranges.
11:39[00:00] How's it going everyone? This video is going to be over ICT's power of three, or accumulation,
[00:16] manipulation, and distribution. We will first briefly go over what open high low close and open low high close is, before jumping into what the power of three is, how to identify and some examples. Now before we begin, the most important part is to have some higher time frame
[00:31] order flow or draw on liquidity. There has to be some sort of narrative or you are just trading patterns. So what is open high low close and open low high close? Open high low close and open low high close just refer to the open, low, high, and close of a higher time frame candle. So for
[00:49] instance, if this is the daily candle and this is the intraday price action, price opens, puts in a low, makes a high, and then closes. Similarly, down here, price opens, makes a high, puts in a low,
[01:06] and then closes. Now the goal is to catch the expansion move or the bulk of the intraday range, and that is where the power of three comes in. So the power of three or AMD refers to accumulation, manipulation, and distribution. Now accumulation is a range or a consolidation. Now what this does
[01:23] is creates buy stops above old highs and sell stops below old lows. Now when they enter manipulation, it is a false breakout outside of this range. What this does is stops out any longs entering during
[01:35] accumulation as well as induces breakout sellers into the market. Then price distributes higher and completes that power of three. So you can see here accumulation manipulates. So what this does
[01:48] induces breakout buyers and run shorts out of their positions and then distributes lowers. So let's go ahead and overlay this on the last example. So here you can see we have accumulation, manipulation which stops out anyone long
[02:03] in here as well as sellers are going to enter the market playing this breakout and then price reverses and distributes higher creating the daily range. Similarly down here, price is consolidating, any early shorts get stopped out, any breakout
[02:20] buyers enter the market, then price reverses and distributes lower. So how and when do I look for entries using the power of three? Well, there are two ways I look for entries here. The first would be within the manipulation.
[02:33] I'm going to be looking for reversal patterns here in the manipulation, looking to catch this whole distribution. However, if I miss this or do not like to trade this, I will be looking for a continuation entry in this distribution.
[02:46] So going back to our example here, for these longs, I could be looking for a reversal here within the manipulation, or looking for a continuation pattern here, looking for higher prices. Similarly, down here, I could be looking for sells on this reversal here, or looking to
[03:02] trade this continuation lower. Let's hop into the chart and look at a few examples of this. So here we are on the charts and the first thing I want to talk about is this concept is fractal. So I can use it on the lower timeframes as well as the higher timeframes.
[03:15] We are first going to go over some examples on the lower timeframes and then work our way to the higher timeframes and the intraday profile. So if you notice here we have New York open making this move up and then all the way back down.
[03:27] So I'm marking out this morning's low. Let's see what happens once price takes this low. So you can see price took this low and we are creating a range or a consolidation.
[03:43] Let's go ahead and mark this out with a green box. So now what is happening here? Liquidity is being built above this high and above this low. So if I'm looking for price to continue lower, I'd like to see manipulation out of this side
[03:55] of the range to go lower. price is going to reverse and go back higher I like to see it manipulate down first and then distribute higher So let see what happens So here you can see we get an aggressive move down which is out of the range sweeping this low
[04:13] and then aggressively back into the range here. So this would be our deviation from the range or our manipulation. So now from here I'm going to be looking for an entry long however I'm not looking for a market structure shift because we would need to break this high up here. So what I can do here
[04:29] is look for inversion or I can also look for the box setup which would be taking this previous body's low over here. So now what I'd look for is price to reach into this inversion now that it is closed over my stop on this low and let's say I'm looking for 2R. And there we go we get our
[04:54] accumulation manipulation and let's go ahead and remove this so we can visualize the distribution which is here so you can see that is our power of three or our accumulation manipulation and
[05:06] distribution so here we are on the five minute chart moving up from the one minute chart and take a moment and look at this price action and what do you see and you might see the failure swings right here on this high and we have sell side liquidity
[05:21] resting right here. So let's see what happens here as price continues. Now if you notice we have a consolidation right here and we are leading this range aggressively.
[05:36] We sweep this low and now we get aggressive movement back into this range. So we have our accumulation, our manipulation, which not only took the lows from our consolidation here,
[05:50] but also sell side liquidity here. And so now what can we anticipate? We can anticipate distribution or a move up to these failure swings. So looking at it, where could we get an entry?
[06:02] Well we have an inversion right here. So looking to take an entry here, my stop on this low, and then my target on this high. We'll see how this works out.
[06:20] And it was pretty messy price action, but you can see that we do in fact get our distribution above these old highs. In this example, we will be taking a look at the power of three for the daily candle,
[06:33] or anticipating the open high low close or open low high close. So here we are just after midnight. Let's go skip forward to the London session.
[06:45] So you can see as we're entering the London session here, what do we have right here? we have a consolidation range. Now what happens during London? We're getting an aggressive move down. Is that met with an aggressive move up? Yes, we put in a downclosed candle here,
[07:03] close above it, retest it here, and are moving higher. So this is our manipulation. So what can we anticipate? We can anticipate distribution higher into the end of London
[07:15] and New York session. And if this is correct, this will be the manipulation of the daily candle and create a wick. So here we start to move higher and there
[07:35] is our New York open and we move higher and higher here. So you can see London sets the lower day here after manipulating the Asian range and then we distribute higher through the
[07:48] New York AM session. Be zooming out and letting this continue until the end of day. You can see we put in an open, low, high close. Our London was the manipulation creating the wick of the daily
[08:04] candle and then we got the distribution or the expansion of the daily candle Let take a look Let look at our next example once again using the daily candle power of three So here we have midnight open Let go to our London session
[08:20] So here we are in London session, and what you notice about this price action here, all we did was consolidate. So let's go ahead and mark that out as our accumulation. What's happening here in London is we are manipulating. So let's see if this is met
[08:35] with an aggressive move back into the range. Because if we fail to displace back into the range, we're likely to go lower. And here you can see we get our accumulation,
[08:49] manipulation, they aggressively displace out and back into the range. So here is our manipulation and now what can we anticipate? Distribution higher. So looking for distribution higher here. So let's let this play out and see what happens.
[09:05] And there you go, you can see we get our distribution higher. So once again, looking back, we have accumulation of the Asian range, London manipulation, and
[09:22] then distribution into the New York open. However, at the New York open, we do reach into this new day opening gap. So let's go ahead and mark that out. Now let's drop down to a lower timeframe and see if we can spot another AMD. So down here on the 1 minute chart, here is our new day opening depth and the consequent
[09:38] encroachment of it. What do we notice about the price action prior to the New York open here? It is just consolidation right? Then what do we have? We have an aggressive move out of the range here. Now at this point we're still respecting the New York opening price and this down close
[09:52] candle so I'd want to see further displacement down to confirm this idea. So here we get that aggressive move down now. So what can I anticipate? form of distribution lower. Now some of you might be asking how do I know how far this distribution
[10:07] is going to go and that is generally when I like to project the manipulation. So here I would be projecting from this low to this high because that's the low that made the manipulation move and it's more visible on the 30 second chart so we will drop down to that. So you can see this is
[10:24] the low that made the new high before we reversed. So going back to the one minute chart this gives us some targets for this distribution. So here we have the 2 to 2.5 and then our 4 to 4.5.
[10:40] So from here do we have any td arrays that line up with that? Yes we have some equal lows right here and then zooming out we have that London manipulation that lines up with the fourth
[10:53] standard deviation. So let's see how this plays out. So we hit our first standard deviation, get a retracement to an up-close candle, we go lower into the 2
[11:08] to 2.5 standard deviations and there we just go sweep those lows And then letting this speed up, you can see we put in more equal lows here, leaving the
[11:29] London low. And then there we take the London low into this area here. One thing I'm going to go over quickly is many people struggle to find the consolidation.
[11:41] Instead of focusing on the consolidation, just focus on where there is aggressive price action out and back into a range. So for example here, after we hit this London low, let's see what happens.
[11:54] Here we get an aggressive move down, and then back into our range right here. I have now identified this consolidation, and then here is the manipulation. So I'd want to see distribution above this high, and possibly up higher.
[12:09] letting this play out You can see we get an aggressive move over this high and then now we get an aggressive move back into this range So now what has happened Let zoom in a little We just identified the aggressive price action here
[12:25] Where is the aggressive price action here? Right there. Now we can identify this consolidation. And then where would we want the distribution? Lower, below this low.
[12:37] And if we're going to get a continuation lower, what is the low that made this high? Right there. Let's see how this one plays out.
[12:49] And you can see how we had accumulation, manipulation, we do distribute over this old high. However, when we displace back into this range, we enter a new accumulation, manipulation, distribution,
[13:04] and this one is going with the higher time frame trend. And the whole point of this segment of this video is if you struggle to find the consolidations, Focus instead on the manipulations and then identify the consolidation range in which this manipulated outside of.
[13:20] So here we are with our last example and let's move towards our London session to see what happens. Here we enter our London session.
[13:33] Now if you haven't already identified the accumulation, let's take a look at the manipulation and then work backwards. So here you can see we get an aggressive move out and then back in.
[13:45] So marking this out and we look left, where is the range that we manipulated out of? Right here. So here is our manipulation. Now where is our accumulation?
[13:59] We mark out this range. So anticipating distribution, where can we anticipate that to distribute to? I can use a projection of this manipulation leg. So from this high to the low that made the new high,
[14:12] which would be right here, and if you can see price went up then down again, this is where I'd want to see price go to. So marking out the 2 to 2.5 and the fourth standard deviation, I want to
[14:26] see price reach for these areas. So visualizing the distribution, I'd want to see price reach or do something like this. Now what would that mean for the daily candle? That would mean that from our open here this is the manipulation of the daily candle which should create a wick
[14:43] and then I'd want to see the daily candle form as it moves lower. So let's see what happens. If you know the box setup you know that a possible entry lies right here when we retest this
[14:56] deviation from the range or the manipulation. Here we reach into the 2 to 2.5 standard deviations or we can anticipate a retracement or reversal and you can see how this daily candle is starting to form. Here we get a retracement back into a fair value graph and these up-close candles here and
[15:16] we start to distribute lower. And there we reach our 4 to 4.5 standard deviations. Here I'm happy with the overall range of the daily candle but let's see if it expands lower.
[15:32] and you can see it doesn't do a whole lot after that. Now taking a quick look at this you can see we have our accumulation, our manipulation, and this manipulation above midnight open will form the wick of the daily candle and
[15:47] then we get our distribution creating the body of the daily candle before it closes. I hope you found this video helpful. If you do want part two of this where I go over AMD paired with standard deviations let me know and I will work
[16:02] on that. If you are looking to get some more information on standard deviations, I will also link Dexter Labs Twitter in the description below. And I hope you guys have a great rest of your day. I'll see you guys next time.
⚡ Saved you 0h 16m reading this? Transcribe any YouTube video for free — no signup needed.