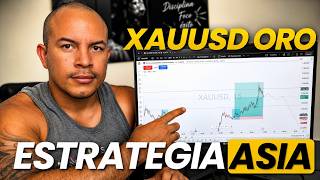

The 4-Hour Candle Gold Secret
40sReveals a simple, time-specific strategy for trading gold without indicators, promising profitability in the Asian market.
▶ Play Clip"The title promises a profitable gold trading strategy, and the video delivers a detailed, actionable method with real examples."
This video presents a trading strategy for gold (XAUUSD) focused on the 4-hour candle during the Asian session. The presenter explains how to identify entry points using the opening price, structural breaks, and order blocks to achieve consistent profitability without relying on indicators.
The strategy centers on the 4-hour candle from 8 PM to midnight, which occurs daily and can be traded without indicators.
Every candle has four phases: opening, creating the minimum (or maximum), building the body, and closing. For a bullish candle, the minimum is created first.
First hour (8-9 PM): opening and accumulation/minimum creation. Second hour: body creation. Third hour: maximum creation. Fourth hour: closing.
AP (Opening Price) is the price at 8 PM. MP (Main Movement) is the first structural break from the opening price, indicating direction.
If no structural break occurs in the main movement, the trade is invalid. The break must be with a candle body, not just a wick.
After the main movement, wait for a pullback to an order block (identified on a higher timeframe like 15-30 minutes) and enter on the secondary movement for continuation.
The strategy works in Asian, London, and New York sessions, but the presenter focuses on the Asian session for gold.
Example shows 8 PM opening, low creation, structural break, pullback to order block, and continuation to 4% profit.
Take-profit should be based on the trading plan (e.g., 1:3 risk-reward), not analysis. The strategy yielded 14% in New York and 12% in Asia in May.
A bearish trade on Monday: 8 PM opening, high creation, structural break down, pullback to order block, and 1:3 profit in under 5 minutes.
Each day has six 4-hour candles, each following the same cycle. The strategy can be applied to any of them.
The presenter argues that many traders overcomplicate with indicators and concepts; this simple strategy is sufficient for profitability.
The strategy simplifies gold trading by focusing on the 4-hour candle's opening, structural break, and order block, with a disciplined trading plan. It has delivered consistent returns in both Asian and New York sessions.
What are the four phases of a candle?
Opening, creating the minimum (or maximum), building the body, and closing.
01:12
What does AP stand for in this strategy?
Opening Price (the price at 8 PM).
05:01
What does MP stand for?
Main Movement (the first structural break from the opening price).
06:13
What condition invalidates a trade?
If no structural break occurs in the main movement.
06:27
How should the structural break be confirmed?
With a candle body, not just a wick.
07:34
What is the recommended timeframe to identify an order block?
15 minutes, 30 minutes, or 1 hour.
06:51
Where should the stop-loss be placed for a buy trade?
Below the 8 PM low.
16:58
What is the typical risk-reward ratio recommended by the presenter?
1:3 (one-to-three).
19:11
How many 4-hour candles occur each day?
Six.
28:12
What return did the strategy achieve in the New York session in May?
12%.
30:45
What return did the strategy achieve in the Asian session in May?
14%.
30:45
Four Phases of a Candle
Fundamental concept for understanding market structure within a single candle.
01:12AP and MP Defined
Simplifies entry criteria into two clear, actionable points.
05:01Structural Break Requirement
Prevents false entries by requiring a clear break with a body.
06:27Real Trade with 4% Profit
Demonstrates the strategy's effectiveness with a concrete example.
18:10Monthly Returns: 12% and 14%
Provides statistical evidence of the strategy's profitability.
30:45Simplicity Over Complexity
Challenges the common belief that more indicators lead to better results.
31:20[00:02] in what normally happens every day, every day from day, every day from 8 pm to 12 am. What happens at that time? At 12 noon, sorry, it would be a 4- hour candle. At that time, a 4-hour candle occurs.
[00:16] If you learn to understand this 4-hour candle, you will be able to make profitable trades within the Asian market by trading gold without the need for indicators, without
[00:30] needing anything else, but simply focusing from 8 to midnight on taking only one candle. In this case, a 4-hour candle is needed to execute the operation correctly . So, how are we going to
[00:43] . So, how are we going to work on it? What is this process called? It's have two types of candle cycle. We have the daily candle cycle and we have the 4-hour candle cycle. Our focus will be on the 4-
[00:58] hour candle. What happens between 8 and midnight? How does it work? How does it work, guys? In the following way. know this concept, we have to see the following. The candle has four
[01:12] the following. The candle has four phases. One is the opening phase, if the candle is going to be bullish. Opening phase, phase of creating a minimum price, phase of creating the body,
[01:27] phase of creating the body, and phase of creating the maximum of the candle. These are the four stages that the market goes through, whether it is a 4-hour candle or a daily candle. In this case, since it 's the gold strategy, we're going to
[01:40] talk about it on a 4-hour timeframe and we're going to talk about it we're going to talk about it here. Opening price, opening price, maximum market price, market maximum and we have the
[01:56] minimum market price. Since we have this thing we just had here, we have closure. As we just saw, you can identify this as the cycle of a candle, in this case a bullish one, to make a completely bullish candle. How are
[02:12] we going to work with a completely bullish candlestick? Internally we have to see that certain things happen. First we will see an accumulation stage during the see an accumulation stage during the course of 8 pm to 9 pm. We have this
[02:27] schedule from 8 pm to 9 pm, two things happen, or rather , only one thing happens, which is the opening process that is normally
[02:39] done with an accumulation and the creation of a minimum price or a maximum price. In this case, since it is a bullish candlestick, a minimum price. This occurs between 8 and 9 pm. I can't give you an
[02:54] exact time because it happens in the first hour of the market. Let's keep in mind that a 4-hour candle is a 4- hour candle. We will be working a 4-hour candle. That 4H candle has 4 hours.
[03:07] The first hour is the opening period and the creation of the minimum. The second hour is the creation of the body. The third hour is the creation of the maximum and the fourth hour is the creation of the closing. We must always keep in mind what
[03:20] is there. So, in the first hour of the market from 8 to 9 pm we're going to have an opening, which normally will be an accumulation, as you can see it in this area. Next, we will see a manipulation that will be
[03:35] generated over the course of 8 to nu. From there we will identify we identify the first structural break based on the structural break based on the market opening, from there, guys,
[03:51] we're going to start placing concepts like order so we can execute operations and profit from the market, that is, go for the price to
[04:03] continue its trend and create that maximum quote price for us. What I'm telling you isn't made up, it's not something new, it's something that literally happens every day in
[04:19] operate within the Asian market. I can't tell you that this strategy works 100% of the works 100% of the time, but it is
[04:31] a strategy that allows me to make profitable trades with a real statistical advantage . What does it mean? We get a 3% return and have a profit margin of over 50%. So, if
[04:47] we come here, this is what happens internally inside the candle. And what is the process? What do we need to do to execute the trade? It's simplified. We will normally simplify our
[05:01] entry points. What we want is to identify the opening price precisely at 8 pm. When it happens at 8 pm, Colombia time, what we are going to start identifying is when the price generates a drop or vice versa,
[05:18] if we have 8 PM and the price starts to rise. If we manage to identify the first sound, the first breakout from that opening price, that's indicating the direction. But please understand
[05:30] that the schedules, the specific schedules for this area, are not fixed schedules, but are approximate. When the price generates the first break of structure, that's where we'll decide that the
[05:42] candle will be bullish, it will confirm the zone, that it is bullish and we'll be able to look for the zone to buy. Our goal is to wait for the order to retrace so we can take the trade. I call this two things, guys. I
[05:58] call this the opening, I give it a name which would be API, opening price. For me, the opening price is a key fundamental AP. Once we have the opening price, we are going to give the first impulse a name
[06:13] , which we will call the main movement, MP. Main movement. What will that major move mean? And main movement? That main movement creates a structural break for us
[06:27] . If we fail to see a structural break in the main movement , the entry is invalidated. There is no scenario, we cannot execute the trade. Main movement. Once
[06:39] we have the main move, which will be the first structure breaker that a boss generates for us, we are going to look to enter directly into the secondary move, that is, we are going to wait for a retreat to an orderblot.
[06:51] orderblot? In what time frame are we going to define the concept of order? We're going to identify it in an area, at a time when we can see it clearly, in a time frame that we can see clearly, a time frame of 15 minutes, 30 minutes,
[07:06] an hour, the better, the longer the time frame it will be for you, clearly. I'll explain it to you in a chart so you can see it,
[07:18] so you can clearly identify the order blot, and we're going to enter right at the secondary MS movement to simply extract the continuation. For us, it's the main movement and the
[07:34] secondary movement, which helps us to determine the direction of the market and then its continuation. The break has to be with a body or with just a wick, it has to be with a candle body. Let's understand the
[07:48] schedules. We repeat the schedules. First of all, we have a 4-hour candle. 4-hour candle. In which session? In the Asia session. Asúal, this happens during the London session, does this happen during the New York session? Does this
[08:01] Let's understand that the day, if we're talking about daily life, the day has six talking about daily life, the day has six candles. Six candles, each lasting 4 hours. And every 4-hour candle goes through exactly the same cycle: an opening cycle, a
[08:16] low cycle, a candle body cycle, and a candle close. It's always the same, but where we have the greatest volatility to see clear movements is in the Asian market, in gold, in the
[08:30] London market, which is also where gold moves a lot in London, and the New York market. So, for me, I see it this way. From 8 pm to 12 am is a candle I can take advantage of. From midnight to 4 a.m. is a
[08:45] candle you can take advantage of. From 4 to 8 in the morning is a candle you can take advantage of. And from 8 in the morning to 12, it's a candle that you can take advantage of if you understand what I'm explaining to you right now. I
[08:58] exclusively for the Asian market, but I'm going to show you that it works at different times with an operation that was completed today and continued within the market, understanding exactly what you're
[09:12] seeing here. We have this, a 4-hour candle. So what do we have? During the first hour of the market, the opening and the creation of the market low will occur. During the second hour of the market, in the
[09:29] following hour we will have what would possibly be the breakout, or rather , the boss for the creation of the candle body. Then in the third hour of the market, we will find what would be the minimum or maximum price of the
[09:43] market. If it's a bullish candle. We will find out the maximum price and, if it is a bearish candle, the minimum price. And in the last candle we will find the actual closing price of the candle. Guys, if you focus on what I'm
[09:58] explaining to you here today, if you only focus on this, you can be profitable. You don't need a second strategy, you don't need a third focus on understanding the candlestick movement and being able to trade that
[10:11] candlestick every day. If you focus on what you need to learn and what you are learning today, I assure you 100% that if you repeat this class several times, you can be profitable. No, it's not a statement like 'it does
[10:24] No, it's not a statement like 'it does n't,' it literally works and I'm going to show you precisely that in graphs. We already have an example up to this questions? Because we'll show you examples in graphs that show
[10:38] real movements, and you'll understand how it works. It work at all times. This minimum or maximum that I marked here
[10:50] a parenthesis here and we'll add wicks here. Highlights. Good. And here at maximum opening we are also going to place wicks, which is the first area that the market indicates to us
[11:04] . Okay, we've got it. Doubts, queries, questions, anecdotes, comments. Do you understand me? Don't you understand me? Only the opening of the market. You just mentioned four schedules you have. I would normally tell you that the
[11:18] hour candles that you can trade. Which four candles are Which four candles are tradable? From 8 pm to midnight. From midnight to 4 a.m.,
[11:32] from 4 a.m. to 8 a.m., and from 8 a.m. to 12 noon. You have four candles so you can see the same market cycle and trade it in the same way. On what timescale do we operate the BOS? The BOS is not managed in
[11:45] terms of time; it is clearly identified . That is, if we go here in this cycle, you can see that it is the cycle of a daily candle, but you can also see a cycle of a 4-hour candle. Now, the important part comes when we're going to
[12:01] confirm the scenario. Let's go here, let's eliminate this and I want you to focus on what we have here. We have, where is the We have, where is the market opening price? Opening price this way
[12:14] . How do we know that this is the opening price? Because the price opens precisely at 4 pm. There we have the first opening price we have the first opening price four. Here they are. We have an opening here.
[12:27] Opening is the first movement that we will know as API, market opening price. Once the market generates the opening price, the first hour will see what would be a minimum price.
[12:41] Since our goal is to trade the 8 pm candle, we are not interested in it. for the daily candle, but since our real objective is the 8 o'clock candle, from 8 to midnight, we're going to focus on identifying the
[12:56] Where is the 8 o'clock candle? Let's take a look this way . Let's reduce the time frame, . Let's reduce the time frame, let's reduce it to 5 minutes. Here's the Opening price. Opening price. 8 pm. 8 Let's see. 8:10.
[13:13] 8:5. Here we have the 8 o'clock opening price. This one here is the 8 o'clock opening price. What's up, guys? Let's see what ends up happening. The price starts to rise, it goes up, then it falls sharply.
[13:31] Okay. What do I see in that falling movement, guys? In this falling zone, it falling movement, guys? In this falling zone, it creates the low of the 8 pm candle, of the 4 hour candle. Here it is creating a minimum quote price for me.
[13:46] What do I need to see in order to actually be able to execute and take the input? A able to execute and take the input? A structural breakdown. Of course, it's not about the structural break that I can identify, that I can see, that I can
[14:00] clearly identify. What does "clearly" mean ? It means that if I map the structure in this lower part, I have a high, I create a low, I have a have a high, I create a low, I have a new high, low, high, low. I want you to
[14:14] you need to identify that area, bullish or bearish market structure in this zone that I just marked here. High, low, high, low, high, make them think I'm low. What do we see there? Bearish or bullish?
[14:31] Exactly, correct. We have her as a bassist. Now, what happens as a result of this movement? When the market creates this zone, when the market does this, right here, what does TXI end up doing? Do you see it clearly, or is it not clear
[14:45] ? It has to make a structural break with a body that structural break with a body that closes with the body of the candle that closes. It is clearly identified that many people call a chos. It doesn't matter if you call it
[14:59] cho, if you call it rock, if you call it paper, if you call it scissors, glue. The name won't change the result. The important thing is that you identify when the structure changes. Once you clearly see the change in structure,
[15:11] you will identify an order blot. Asrubal, you can clearly locate order block here . If we come here, we're not going to see a clear order block there. We're not going to be placing it clearly. Now, what do we need to keep in mind?
[15:27] The opening price of the 8 o'clock candle was this, it makes the low of the 8 o'clock candle, it makes a break of the 8 o'clock structure. And here we could see a small order, but let's go up a time frame. We need to see a
[15:43] block order clearly. And what does it mean to see an order clearly? It means seeing a candle, a candle, and then from that candle there is a strong movement in one there is a strong movement in one direction. We need to see
[15:57] this: a candlestick, and after that candlestick, a strong movement is generated, and it should be generated as clearly as possible so that we can use this last candlestick, including the wick, as a reference point to
[16:13] execute the trade in favor of the main movement. This first structural break that the price makes towards the upper zone tells us This is what we will call the main movement. MP
[16:30] call the main movement. MP main movement. We went up to 30 minutes, it's not identified. And in 30 minutes we'll start to see it a little better. The order can be placed much better here. What are we going to be
[16:43] doing, guys? Now that we can see the orderbot more clearly, let's place our entry price right at that low point and our stock. Pay attention to this information I'm going to give you: our SL should always be
[16:58] give you: our SL should always be below the 8 pm low. What was the minimum amount it generated for you? What was the minimum or maximum amount you earned at 8 pm? Main movement. We are waiting for a pullback that will mitigate the orderblot so
[17:11] we can jump on the secondary move. secondary move. M looking for MS. What's happening with the market? He retreats to the zone. He arrives in the area right at 12. Uh, he's
[17:24] coming. Here I have it for a longer period of time. They arrive in the area just as they do. I have the schedules mixed up here. We have the opening, I have the movement here. Opening at 8. We'll be ready in 5 minutes
[17:40] . 8th. Break structure towards the upper zone. Retreat to the zone. Main movement. Secondary movement.
[17:54] Main movement. This is the main movement and we enter secondary movement. Guys, what happened? The price went straight to the TP. Our goal yesterday was a one to four position.
[18:10] students who are students in the New York program and the Asia session will not let me lie. You won't let me lie because if we go to the New York, Asia, or whatever, logbook, we'll realize that this trade, this was the before. This
[18:24] was the trade before. Main movement, retraces to the zone, opening price, structure one break, structure two break, retraces to the zone and we await continuation. What did the price do? We await what comes next.
[18:42] Boom, it bursts the zone above and ends up with a 4% profit. It breaks down structures in the area above and ends up with a 4% profit. ends up with a 4% profit. What do we do? It involves taking the
[18:56] opening price at 8 o'clock, identifying the structural break, the creation of the 8 o'clock low, and always looking for the continuation. The movement is literally simple. Now, Asdwal, this works for the TP you're putting into
[19:11] your trading plan. Your trading plan, a trading plan, guys, a well-crafted trading plan . The trading plan says, how many stock picks are you going to leave? A trading plan says, what will
[19:24] your potential RR be? So, if my trading plan says, what trades are you going to look for?" One to three, because you are a trader who trades one to three. No, but the thing is, I have more
[19:39] knowledge and more experience, and I know that those moves can give me a 10 out of 10. 'm a trader who looks for 1 out of 10 trades, and I'm going to let my trading run at a 1 out of 10 rate. That's established within the trading plan, not within the
[19:53] trading plan, not within the analysis projection. Never, ever look for the RR, the TP through analysis; look for the TP based on what your trading plan says the TP based on what your trading plan says . If you want to operate the New
[20:06] York with this same structure, you will realize, you don't even have to believe me, you will realize that from 8 to 10 in the morning the exact same procedure occurs. Opening at 8.
[20:20] Identify. We have it here, let's see where we see the 8 o'clock position. Opening of the see where we see the 8 o'clock position. Opening of the 8 o'clock position, creation of the 8 o'clock low, main movement. Main movement of the 8. Retreat the area and
[20:35] give a continuation. Where? In your order block. Your orderblot reaches this area and mentions an operation. I did n't take advantage of today's trading in New York because the month is already over, I already
[20:48] have a 12% return per month and I wasn't interested in opening any trades today. market. If you think about it, the trade ended up working out for you. If we look at it, it's a complete daily candle cycle, but it fulfills both candles, a 4-
[21:05] but it fulfills both candles, a 4- hour candle and a daily candle. Follow up, guys. What we need to focus on. He tells me, "I got confused about the order, you mark it the same way the ch did." You have to mark the
[21:19] the order block. Clear. If we have an opening, , let's draw it more easily for you. The input pattern is this. You see this
[21:33] in the opening of 8 to 9. Look at this, it breaks the structure. You see the expected setback. Where will the retreat wait? You place the order blot at the bottom. Let's be clear. Often that blot order is
[21:49] right where the structure breaks down, then a little further down and you wait for the market to continue. Same here. How well does this work? If Same here. How well does this work? If we come to the Monday that we
[22:03] operated on the same Monday, Monday gave us this same position exactly the same in sales, a 1 to three in less than 5 minutes. This entry was taken with the traders I trade, New York session and Asian session.
[22:16] We do this with my students. And what my students learn in the New York Asia session is to understand these movements by applying them live every day. On Monday we'll go to the Monday we have here.
[22:35] This one here, Monday. This is the same trade that you see was executed in this area. in this area. How do we see it? We see it right here.
[22:48] We're looking for the candlestick at 8 o'clock. They need to backtest this. Open the candle at 8. Here the candle opens at 8. What does the candle do at 8? It generates a maximum.
[23:05] maximum. Let's see, a maximum of 9. back away. Boom. Operational sales entry on Monday from this point which ended up
[23:19] less than, I think it was in less than 5 minutes. This operation was literally the cleanest operation that I can see that we have taken, which is this operation that you can see
[23:32] here. That's why I document things to have the before. This is how it worked before. This was the operation where the trade was executed and this was the aftermath. Operation exactly one to three. Maximum opening of the 8 o'clock candle,
[23:48] practically medium accumulation, manipulation, distribution. That's exactly how a candle works. The candle works through accumulation, manipulation, and distribution. Then in the New York session, that same day, that same
[24:00] day, that was Tuesday, for Tuesday in the New York session an operation was also executed that was on the 26th that a TP 1 to TR came out. How was that TP that gave us the gold market 1 to TR? The same in the New
[24:17] 8 in the morning. Let's see where we have 8 in the morning here. this way . 8 a.m. Let's place it at 8 in the morning. Price. It's rising sharply. It creates the
[24:32] best for us. Notice, it creates the high for the day and the price falls. It makes the first structural break, 4-hour candle. Our goal is to enter a 4-hour candlestick pattern. Where did it fall? It ended up falling to
[24:48] this point. We closed the operation; our objective was a 1 to tr position, and the operation ended up falling.
[25:00] Look at the pattern. This pattern can be seen here in sales. We have an opening. Look how the opening always happens.
[25:15] the boss, breaks structure. Where can we see the boss? Let's see what we have. The opening move, this part here, which is what we are going to call the
[25:28] main move. It works for New York. It works for New York. It works for Asia. It works for Asia. We are open. We will refer to this point open. We will refer to this point as AP. This is the minimum case because it's
[25:41] the entrance. This is a minimum sales position that is created. After we see the minimum, we identify the minimum, we identify the main movement. MP main movement. And
[25:55] main movement, we're simply going to follow the market direction. What are we going to do? We expect a setback precisely
[26:07] where we identify order, in a clear way. We don't see it here. We increased the time frame by 15 minutes. If I increase the time frame to 15 minutes, will the time frame to 15 minutes, will you be able to see the order correctly here,
[26:19] or can the blot order not be seen correctly in this area? Can you see it or not? going to place a block order that is clearly visible. MPI. I expect the pullback to
[26:32] the MP order and I will enter precisely on the secondary movement looking for a position depending on what your trading plan says. If your trading plan says one-to-three positions, my recommendation to anyone
[26:47] who trades is always to place one-to-three trades above one-to-three. This strategy meets very nice parameters one to three. We have completed parameters here, look, this is in New York.
[26:59] Also in New York we see this is the position before, this was the position before where we took the trade and this was the position after in New York. 1 to 3. The price falls, boom, we finish the 3%, we close 3%.
[27:14] Then the gold market, main movement and we enter the . No, in this case I don't is only the main movement, a return to the orderbo continuation in the
[27:28] direction. 4-hour candle. Continuation of 4-hour candle. If we go down here on Monday, if we want to see it as bullish, today Friday it ended up giving us exactly the same thing as New York, it did exactly the
[27:45] same thing. We have the opening of the 8 o'clock candle, it creates the low, it creates the structure break, the market retraces to the zone, it continues again and continues until
[27:59] and continues until we complete one to three. today, from everything I 've talked about, and to keep the concept in mind, is that every day four candles occur, or rather, six
[28:12] 4-hour candles occur. Six candles appear every day. Let's mark it like this so you get the idea. Six candles each 4 hour candle. Each of those 4-hour candles completes what is known as a
[28:27] cycle. What can we call that cycle? AMD, momentum, pullback, main move, whatever you want to call those 4-hour candles. What is the important part of the 4-hour cycle? The opening. You determine where you have
[28:40] The opening. You determine where you have the AP, the market opening. minimum price and after the minimum price, see that there is a structural break in the opening price. If that happens, wait, pull back to the zone,
[28:54] and execute the trade. Don't overcomplicate it. Execute exactly this, as long as you clearly understand what I am telling you. What does he mean clearly? On Thursday, look, I think it was Wednesday,
[29:08] I didn't operate. Look at this. This was the 8 o'clock move. We have an opening price here at 8 o'clock and at the 8 o'clock price this point melts. It's
[29:20] giving me entry here, it's confirming how I like it, that it's the maximum opening and the structure breaking. The main movement for the retreat so that I can enter. He's not giving it to me. What did I tell you on
[29:33] Wednesday? I did not operate that day. I don't see the stage. Of course, I don't operate. Simple. I hope the market will be open the next day , that it will be clear enough for me to execute the trade. If I don't see the trade clearly, I don't take the position.
[29:49] 'm not looking at the parameters of my entry? Do you understand what the parameters are now? The parameters are opening price, creation of the low, breakout, structure, blot order, of course, so that I can jump on the secondary movement.
[30:05] Everything I explained in this scenario can be seen for purchases, for sales. And what I always tell them with each class is, you several times. I'm uploading it to YouTube right now so you can watch it several
[30:18] times, so you can review it. But in addition to that, you have to practice it and identify it. Don't just take my word for it , practice it you'll realize, if it's true, what the professor is
[30:33] explaining to us in this class really works, and you'll be able to apply it in the market as many times as necessary. Guys, that same strategy allowed us to achieve a 14% return in the New York session market
[30:45] in May. 14% return for the month of May. In New York it allowed us to achieve a 12% return, same strategy, same parameters, exactly the same thing applied.
[31:01] Whose responsibility is it to implement from now on ? Well, you, about yourself. Doubts, queries, questions, anecdotes, comments.
[31:20] strategies for trading will only lead to more confusion. People are getting involved, people are getting involved, Orderflow, uh, indicators, getting involved, uh, what's Uh, what's this called? which are market correlations.
[31:36] Market correlations and hundreds of concepts are included . You don't need hundreds of concepts to make money in the market. Do you understand what you don't? Look of concepts here? Look at this operation. The operation we can see is the operation
[31:51] of Monday one to three or this one that gave us 1 to 7. This one ended up completing 7% in profit for us. This entry that you see here, we make a 7% profit on this entry.
[32:10] mini, maximum, break, structure, pullback, sales one to seven. Why do you need to fill yourself with more concepts, more strategies? If you can simplify the strategy into three, four, or five points
[32:22] three, four, or five points and win. The important part is what you allows you to make withdrawals or not . If it doesn't allow you to make withdrawals, what good are millions of accounts if you can't
[32:35] make withdrawals? Works? Uh, it works for any asset applied it a lot to the pound sterling. Furthermore, the free pound gave us a 1 to 12. What scenario here completed a 1 to 12 for us? It
[32:49] 'm not currently trading free sterling, but this scenario, this this was, let's see, it was on Wednesday, I think it was, right? Friday, this was, uh, let's see, it was a purchase
[33:05] here, but this one was seen with the least temporality, uh, 8 in the morning, right? This wasn't it. There's a pattern. I think this was it . Ah, yes, this entry. This, through this
[33:19] entrance, there was an entrance that we took over here. I like it because right now I'm mostly working with gold, 100% focused on gold, but it does happen in several places. Which broker do you use? I'm currently
[33:31] those who want to use the same broker, I'll give it to you right now . I always watch your good, but sometimes I wonder, which one is the best? Apply one and that's it. Professor, I have one question. If, as
[33:46] you explain, the entire trend of the graph should not be taken into account when applying what you applied, it would be much better. Which is better? Go with the trend or against the trend?
[34:01] always going to be much better to go with the trend. The thing is, they have to explained within the New Year session program and the Asia session. These concepts are explained every day in the New Yor Asia session . Every day they are seen
[34:13] live and they explain in more detail how this thing here is.
[34:31] What time do I operate? I operate every day in the New York session from 8:30. to New York 8:30 AM to roughly 9:30 to 10 AM. We'll set it up at 10 am and at night I operate from 8 pm at the
[34:47] latest until 10 pm at the latest. All those transmissions are only via Zoom and are only for the students who are with me in the exclusive program for students who are in
[34:59] session in New York and Asia. Good. Yes, I'll send you the recording of the guys. A profit is generated, it's the same as what is sent through the signal group and that's what you see here. You see this here, this
[35:12] profit that was made. And look, because anyone can hide their losses from you, they'll say, "No, you're not going to lose with this strategy, no, we'll also have stop losses, we do have stop losses, but despite the stop losses, we have a
[35:24] real statistical advantage that allowed us to achieve 12% in New York and 14% in Asia, despite the stop losses. sign up? I'll send you the registration link right now, so you can
[35:41] join. I'll send it to you right here. I'll send you the registration link, sign up. If you're going to sign up, there you go. Also, if you're going to sign up, you
[35:54] can send me a message on WhatsApp if you have any questions. There you on WhatsApp if you have any questions. There you
[36:07] Apply it. You saw it, you learned it? Have you been here yet? learned it? Have you been here yet? Apply it live. Uh, I think that's the monthly login link.
[36:20] Sabrina, that's a monthly subscription. I just left the registration for you. The monthly subscription is $87, or $700 for the year. Here's my WhatsApp number. I'll write my WhatsApp number here, and you can send me a WhatsApp message if you
[36:34] 're interested. It's +57
[36:48] concerns about the program, ask me here. complete psychotrading program. Every Friday, we'll have 10 continuous psychotrading classes where we'll specifically discuss your self-sabotage,
[37:04] how to use autosuggestion to achieve improve as a trader to maintain your success over time and achieve positive results. So, on Fridays, in addition to... Psychotrading,
[37:17] , which is more than 50 hours of recorded classes, explaining the strategy in detail, plus the operations we have, the operations we have every day from Monday to Tuesday. Do
[37:32] you have an audited account? Yes, my account is audited. I have the first three Here are my first three months of this year. Uh, where are they? Let me see . I have all these, I think it's this one . Here it is. The first three
[37:48] months of the year. I have a 40% return in the first three months. 6%, 11%, 17%. You might say, Asrubal, what happened with April and audited? Because I was with this broker, and being Venezuelan, I had to
[38:03] change brokers because they restricted Venezuelans from trading with the broker I was using, which in this case was HFM, where I was trading. But in the first three months of the year, I have 40% profitability
[38:15] strategy and the same approach applied in both the New York and Asian sessions. I have guys. I've been trading for six years, and I assure you I know a thing or two. [laughs]
[38:27] think, DeNE?" It started recently. How much is the monthly subscription? $87. How can you become my students? Write to me here, send me a message here on enroll me in the program?" And that's how we can get
[38:43] hug. I'm sending you the lesson so you can review it and apply it. I'm sending you a big thanks for being connected. See you in future sessions.
⚡ Saved you 0h 38m reading this? Transcribe any YouTube video for free — no signup needed.