
Why I Don't Trade Monday-Wednesday
44sTraders love hearing contrarian takes on when to sit out, and the economic calendar logic is a quick, counterintuitive hook.
▶ Play Clip"Delivers a solid trade breakdown with a clear process, though the title promises a 'breakdown' and it delivers exactly that, with some minor fluff."
This video is a detailed trade breakdown of a forex trade setup, focusing on the process of analyzing the economic calendar, establishing higher time frame context, and executing an entry on lower time frames. The creator explains his three-step process for identifying and trading high-probability setups, using a specific example from a week with low volatility early on and high-impact news later.
The creator starts by checking the economic calendar on Sundays to plan the trading week. He identifies days with no red-folder news (Monday-Wednesday) as low volatility, expecting accumulation, and days with red-folder news (Thursday-Friday) as high volatility, expecting manipulation and expansion.
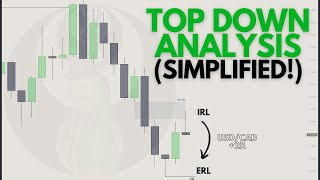
He establishes context on monthly, weekly, or daily charts by looking for internal range liquidity (IRL) or external range liquidity (ERL). In this case, a weekly fair value gap (IRL) with bearish order flow sets the expectation for lower prices.
He watches about 27 pairs, explaining that higher time frames develop slowly, so watching many pairs increases the chances of finding a clean setup. He is very picky, only trading textbook setups.
After establishing weekly context, he drops to the 4-hour chart to find a fair value gap (PDR) that displaces price away from the level. This becomes the array to frame a trade from.
He then looks for a 15-minute fair value gap for entry, but if that is not available, he drops to the 5-minute chart. In this case, a 15-minute breakaway gap formed, indicating price would not retrace, so he went to the 5-minute chart.
The aggressive close below a candle's low made it a breakaway gap, signaling price would not retrace up. This is because price was too close to the draw on liquidity, making a retracement unlikely and unhealthy.
On the 5-minute chart, he identified a fair value gap and an order block. He placed a limit order at the top of the candle (low of the FVG) with a stop-loss above the order block, expecting the level to be respected.
He explains there are two ways to enter off a 4-hour fair value gap: a 15-minute FVG or a second high probability leg on the 5-minute chart. The latter provides extra confirmation, using a second FVG in a second leg.
He set a target at 2R, scaling 80% at 2R and 20% for final targets when conviction is high. However, due to low probability market conditions, he took the full profit at 2R.
The process is: 1) Higher time frame context (weekly/monthly/daily), 2) Intermediate term PDR (4H/1H), 3) Lower time frame entry (15M/5M). This ensures price and time alignment.
The video provides a clear, systematic approach to trading using higher time frame context and lower time frame entries, emphasizing the importance of the economic calendar and patience. The creator's three-step process is a repeatable framework for identifying high-probability setups.
Economic Calendar as Roadmap
Emphasizes the importance of planning the week around high-impact news, which is a fundamental principle for trading.
Higher Time Frame Context
Explains the use of IRL and ERL to establish a bias, a core concept in smart money trading.
01:42Breakaway Gap Logic
Provides a clear rationale for why a breakaway gap signals no retracement, based on proximity to liquidity.
07:19Two Entry Methods from 4H FVG
Offers a flexible approach to entering trades, allowing for extra confirmation when needed.
10:18Three-Step Process Summary
Condenses the entire strategy into a simple, repeatable framework that traders can apply.
13:04[00:00] What is up guys welcome to a UCAS trade breakdown and let's dive right into it. Alright so as always I'm going to look at the economic calendar first before I even open the charts right so let me take you through my process right here. On Sundays is when I get ready for the
[00:15] week and first thing I do is open Forge Factory and check out the economic calendar. So this is actually this week it's the last week. As you can see Monday, Tuesday, and Wednesday had no
[00:29] red folder news. The economic calendar is your roadmap. What does that mean? It's going to tell you what days you could trade, what days you can't. Monday, Tuesday, Wednesday,
[00:44] for my system, for my strategy, I'm not going to trade. It might be different for you. You might have a different system. But for me, I'm not going to trade because for me, I'm looking for a highest probability expansion date. Monday, Tuesday, and Wednesday lack
[01:01] red-folded news. The expectation in my eyes is that they are going to lack the energy and volatility price needs to get to its objectives, to get to its draws on liquidity, okay? Thursday
[01:16] and Friday have red-folded news. So my expectation coming into this week is Monday accumulation, Tuesday accumulation, Wednesday accumulation, Thursday manipulation reversal down into a
[01:29] Friday expansion. Okay, that is my expectation coming into a week like this where we have no record in the news to begin and then Thursday, Friday we do. Alright, so that is my expectation going into the week.
[01:42] I already know I'm not going to look at trades. I'm not going to look to trade Monday, Tuesday or Wednesday. So that being said, let's just dive right into the charts. As always I'm going to look for higher time frames concepts.
[01:56] Now what does that mean? For me that's simply ERL to IRL or IRL to ERL. If you don't know what that is, IRL is internal range liquidity.
[02:10] It is a fair value up or an efficiency. ERL stands for external range liquidity which is simply a swing high or a swing low. here we have our weekly IRL that weekly fair value gap the expectation is for
[02:27] lower prices we have bearish order flow here expectation is the price to continue lower off of where this fair value gap towards what this extra
[02:40] low end liquidity right this is the context this is where you're going to find your lower time frame market maker sell models. Okay? So our context is established right here.
[02:52] And I'm looking for these contexts on the monthly, weekly, or daily charts. Now I get a lot of questions going over how many pairs I'm watching. Right now I believe I'm watching about 27 or so.
[03:07] And people ask, well how can you keep track of so many pairs? Well, it's very simple because the higher time frames take a lot of time to develop, right? Because I'm looking at the monthly, weekly, or daily charts.
[03:19] If I only looked at two pairs, like maybe ES and NQ, I'd be waiting a long time before something clean sets up. And I'm very picky with the things I'm looking for on these higher time frame charts. It has to be super clean it has to look textbook it has to stick out like a full okay so over here on you can give a very nice setup okay yeah this
[03:40] weekly internal is equitably actually only the quitting the context so with the context now being established here very clearly we can now dive into the four-hour chart why because that's the time frame alignment we're using we
[03:54] didn't know from a weekly chart you want to go into a four-hour chart and look for a four hour fair value gap displacing away from this level and that's all I'm going to look for okay it's very simple go from a weekly level to a four hour
[04:08] time frame so here is that four hour chart as you can see we have that four hour fair value gap displacing price away after taking this liquidity right here into this weekly fair value gap that's internal range liquidity there is a
[04:23] four hour fair value gap that is going to be the PD array we're going to frame a trade out of. Okay so this is part two. Part one is establishing that higher time frame context.
[04:35] Part two is establishing that PDR we're going to look for an entry out of. That PDR is usually on an intermediate term time frame which for me are the four hour charts and one hour charts. So right here since we're working off of a weekly level we're going to look for a PDR,
[04:51] a four hour PDR to frame a trade out of. So here is that four hour value gap. Now we want to dive into the 15 minute chart and look for a fair value gap there okay from a four
[05:04] hour chart you can go into a 15 minute entry and if you can't find that 15 minute entry like I'm going to show you in the next time frame as we drop down you can even drop lower into the five minute okay now I'll show you right here
[05:16] go into a 15 minute let me clean this up and do that for the Twitter screenshot so So we had that volatility injection right here on Friday as you can see that was PPI
[05:33] 830. What we could also see is that on Thursday we had that CPI volatility injection right here at 830 as well. That was that manipulation remember I was expecting manipulation on Thursday?
[05:49] That's that manipulation that I was looking for right because what happened Monday, Tuesday, and Wednesday? Consolidation. went nowhere we went nowhere we were just consolidating all throughout them
[06:01] up until this point right here so this is that accumulation manipulation what I wanted to see lower I mean what I wanted to see happen on Friday was further continuation lower that distribution that didn't end up happening right here
[06:15] we actually displaced up higher after taking that four hour extra range liquidity but that's besides the point that's not the trade I'm trying to review right now let's review the actual children okay so going into Friday right here
[06:32] it's a four-hour for value gap remember now all we're looking for is a 15-minute for value up so here's that 15-minute displacement via fair value gap I'm looking out of that for our fair value up okay now I got so many questions
[06:48] asking me why is this a breakaway gap and why did I expect price not to fill this why did I come down to a five minute chart and enter down here this deep in the discount and not wait for a retracement to then go lower now it as simple as this you see the low of this candle right here You see how let me move right here So this is what it looked like at the time right
[07:19] Do you see how aggressively we closed the low this low? Do you really think the expectation, do you really think the most probable thing for price to do at this point once this candle closes is to retrace all the way up?
[07:32] After being so close to the draw liquidity here, after being so close to our target, going all the way up here to then go down? No. That's just not likely. And that would actually be quite unhealthy.
[07:45] Because we are so close right here. We have so much energy towards here. That's just not likely. Now, the trick here is this close below told you everything.
[07:57] That close made this a breakaway gap. because if this candle failed to close below it, I wouldn't consider this a breakaway gap, right? Because if we decided to wake, then I could see the possibility of going up here to go down.
[08:12] But it's the fact that we closed so aggressively below it that gave me the indication that price does not want to come up here. It does not need to do that. Okay, so just this, the close below this candle right here,
[08:27] told me that this is a breakaway gap. Ok, so once this occurred, I knew I couldn't use this as an entry, so I dove into the 5 minute chart and looked for something there.
[08:39] Now on this 5 minute, what do we see? Well we see the formation of this 5 minute survival gap right here, and we also have this 5 minute order block right here.
[08:52] So keeping in mind that the expectation is for this not to get filled, we don't need retrace all the way back here before coming down to this four hour external raise liquidity okay it is within that idea that i wanted to take a trade off of this five minute pdr of this five
[09:08] minute fair value gap okay and at most at most i don't want to take over this order block i want to see this get respected i want to see this for value gap get respected so what i did is i set a
[09:21] limit order right here the top of this candle which is basically the low of this four-value gap okay my order goes there my stop-loss goes above this order block
[09:33] why well most I want to see this new threshold get respected once you start closing above it and messing with the top of this order block I want to be out because so I failed to properly explain this in the original recording so I'm
[09:48] going back and explaining it right now. So the reason I'm entering off this five minute fair value gap here and not off of a 15 minute array is because you can have two different ways of entering off of a four hour fair value gap okay. So like I said we had that 15 minute breakaway
[10:04] gap which I didn't expect price to come into and I knew that the only way I would have been able to play this is if I dove into a five minute chart and looked for the second entry model Okay, because there's two different ways you can enter off of a four hour fair value gap.
[10:18] It doesn't just have to be a 15 minute F.E.G. You could also enter off of a five minute fair value gap on a second high probability leg. Now what does that mean? What's a high probability leg?
[10:32] Well, essentially it just has to contain a fair value gap, right? A leg is a swing high to this swing low and it must contain a fair value gap right so we hit the higher time frame pd array we have this original high probability leg right here so here your
[10:49] first five minute fair value gap in the high probability leg we could enter off of the formation of a second five minute fair value gap in the form of a second high probability leg so we have that right here with this swing high with this swing low and this retracement right
[11:05] here to this fair value gap is an entry and you can place your stop loss right here above that swing high that's a safe spot right but for me this wouldn't give me the proper RR so I can move
[11:17] my stops a bit lower to another valid level which would be the high of this order block body giving me that desired 2R that I am looking for okay so I'm playing this leg right here down towards this
[11:30] four hour external range liquidity so that's the reason I could enter off of this five minute fair value gap instead of waiting for a 15 minute array. It's simply waiting for that second high probability leg on the 5 minute chart because
[11:42] you're demanding more confirmation by going down into a lower time frame off of a 4 hour array. So instead of using that one fair value gap in the 15 minute, you go down to the 5 minute and look for that extra leg because you were looking for extra confirmation.
[11:56] Alright? So, credit to Arjo for this entry model. I learned it from him. Big shout. I always give credit where credit is due. So, yeah. This is essentially the ST model on the 5 minute chart, that double ST which we're waiting for that initial high probability leg, that initial 5 minute fair value gap, and then that second fair value gap in the form of that second high probability leg.
[12:21] So now I have my entry, I have my stop loss, and I have my target fixated at this strict 2R level. As always, that's where I like to target. What I like to do sometimes when I have high conviction on the play is I'll scale 80% at
[12:35] 2R and then lead 20% for final targets. But over here I knew the market this week has been very very low probability, not been
[12:47] the nicest price action. So I didn't trust it on having a large run below it. So I decided to take it all off right here and basically let's just see how this trade it up is that retracement into it so after our value gaps and I were in the
[13:04] trade and boom that's it simple is that so to wrap things up here it is simply a three-step process you're gonna need a higher time frame context which is on the weekly and that monthly chart on that daily chart and I have that
[13:19] intermediate term time frame PDR in your four hour or one hour charts in this case we have this 4 hour PDArray, 4 hour fair value gap to frame an entry out of and then you're going to get your lower time frames to base your entry. So in this case I expected
[13:35] this not to get retraced towards so for that reason I dropped into the 5 minute time frame and looked for a PDArray down here to base a trade out of towards this external range low and this is the lower time frame entry PDA that was used.
[13:53] This is a 5 minute fair value gap for these 4 hour external range lows starting at 6.21. Very simple price and time are aligning right here and I hope you learned something from
[14:06] this I'm going to look to upload some more of these as the year goes on so if you enjoyed it please subscribe and thank you for watching. Have a good one guys.
⚡ Saved you 0h 14m reading this? Transcribe any YouTube video for free — no signup needed.