
Candles Reveal the Battle: Buyers vs Sellers
43sThe metaphor of a battle between buyers and sellers is compelling and visually explained, making it highly shareable for trading beginners.
▶ Play Clip"Delivers basic candlestick knowledge but oversells with 'BASE' and ends with a promo pitch."
This video explains the basics of candlestick charts and market dynamics for beginner traders. It covers the anatomy of a candle, the battle between buyers and sellers, and the concept of timeframes and fractality.
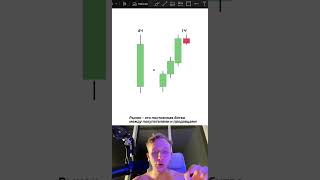
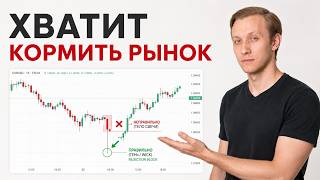
Candles are not just pictures; they are a visual report of the battle between buyers and sellers. More purchases (demand) push price up, more sales (supply) push price down.
Each candle has four key levels: opening, low, high, and closing. The opening is where price starts, then it goes to the low, then to the high, and finally closes.
The big rectangle (green or red) is called the body. The sticks at the top and bottom are called shadows or wicks. In a bearish candle, the opening is higher than the closing.
A candle on a higher timeframe (e.g., 4H) can be seen as multiple candles on a lower timeframe (e.g., 1H). This principle is called fractality. Most people don't understand this and make trading mistakes.
Understanding candlestick anatomy and the fractal nature of timeframes is fundamental for trading. The video also promotes a Telegram channel for further training and signals.
What are the four key levels of a candlestick?
Opening, low, high, and closing.
00:15
What is the body of a candle?
The big rectangle (green or red) representing the range between opening and closing.
00:45
What are shadows or wicks?
The sticks at the top and bottom of the candle body.
00:45
In a bearish candle, how does the opening compare to the closing?
The opening is higher than the closing.
00:58
What is fractality in trading?
The principle that a candle on a higher timeframe can be seen as multiple candles on a lower timeframe.
01:14
Candles as a battle report
Establishes the core metaphor that candles represent the ongoing battle between buyers and sellers, which is fundamental to technical analysis.
00:02Four key levels of a candle
Provides a clear, actionable breakdown of the essential components of a candlestick, which is crucial for beginners.
00:15Fractality and timeframes
Explains a key concept that helps traders understand how price action on different timeframes is related, a common source of confusion.
01:14[00:02] simple truth. Candles are not just pictures. This is a visual report of the battle. About the battle between buyers and sellers. Remember, the more purchases, the higher the price, because there is more demand and more supply. More sales equals a lower price because there is more
[00:15] supply and more demand. The market is a constant battle between buyers and sellers. Now let's talk about candles in more detail. Each candle has four key levels. The first level is the opening, which is where the price
[00:29] starts trading in a specific time period. Then she goes down to the very bottom and reaches the second level. After this, it reaches the third level - this is the top, the most maximal. And after that, the closing occurs. This is the fourth
[00:45] level. Also, if you don't know this big rectangle, it's either green or red, it's called the body. These two sticks at the top and bottom are called shadows. Some people also call them wicks. We looked at a
[00:58] bearish example. Everything is absolutely the same, the only difference is that the opening is higher than the closing. The price opens, reaches the very top, then reaches the very bottom and then closes lower. Also
[01:14] remember another very important point - this is the principle of fractality and time frames. Open the four-hour time frame and you will see only one candle. Further, if you switch to a lower time frame, for example, 1 hour, you will see this same candle
[01:27] in detail for four candles. The same thing will happen if you fifteen-minute chart. Depending on whether the timeframe is larger or smaller , you will see the required number of candles that reflect the
[01:41] market situation in a specific period of time. Most people do not understand this simple truth and therefore make mistakes in trading. Want to trade more Telegram channel and join the free trading community. There I conduct
[01:55] light trading every day, where I publish specific entry points, stop-losses, and take-profits. There is also free training if you are a beginner, and personal questions. The only condition is to trade with me on my
[02:09] trade with me on my partner broker. Waiting for you inside.
⚡ Saved you 0h 02m reading this? Transcribe any YouTube video for free — no signup needed.