
Stop Overcomplicating Your Chart Analysis
46sThe blunt advice to simplify and stop staring at charts all day resonates with struggling traders and invites engagement.
▶ Play Clip"Delivers a solid top-down analysis framework with a real example, though some fluff and self-promotion."
This video provides a step-by-step guide to analyzing price charts using a top-down approach, starting from higher timeframes (monthly, weekly) and moving to lower ones (daily, hourly, minute). The presenter emphasizes the importance of structure, liquidity, and manipulation, and demonstrates the method with a real EUR/USD example.
Regardless of trading style (intraday, swing, positional), always begin analysis with higher timeframes and move to lower ones. This ensures you see the overall picture.
Avoid overcomplicating your analysis. Stick to the basics you study. Strength lies in simplicity; complexity only confuses.
Spend 30-60 minutes a day analyzing and developing a trading plan. Set alerts on areas of interest and then observe. Staring at the chart leads to seeing false patterns and losing trades.
What you earn today you may lose tomorrow if there's no system. Trading is a potential earning opportunity over time, not in the moment, and it's not for everyone.
News is bait for 'hamsters'. Everything needed for accurate analysis is on the chart. News can be traded but requires experience; most lack the skill.
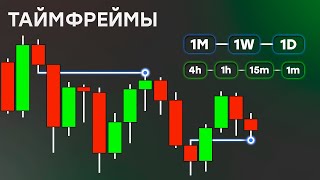
A cheat sheet is provided. Start with monthly, then weekly, daily, hourly, and minute. Higher timeframes always take priority.
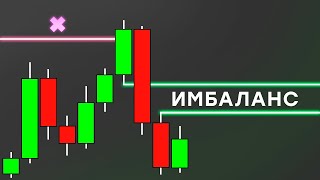
Look at structure to determine market sentiment and preferred direction. Identify liquidity (significant highs/lows) and manipulation (activation of stop losses).
Spend more time here. Look at structure, identify support/resistance zones, and liquidity. If trend disagrees with monthly, rely on monthly and wait for support test.
Main analysis is done here. Look at structure, previous day's high/low, and significant support/resistance zones consistent with the trend.
Same hierarchy: 12h, 4h, 1h. Determine structure, find synchronicity with higher timeframes. Look for manipulation of highs/lows in zones of interest.
Use minute charts only for entry. Switch only when price is in your zone of interest. Don't open trades prematurely; place stops on higher timeframes for better risk-reward.
Never place a stop loss in the air. It should be reasoned, behind local support/resistance on higher timeframes.
If risk-reward doesn't suit your strategy, skip. There will be more opportunities with better risk-reward.
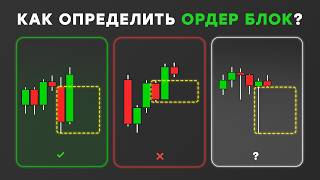
Analyze monthly: downtrend, lower lows/highs, sideways range with liquidity. Weekly: bearish order block, hidden bearish divergence. Daily: support/resistance zones. Hourly: manipulation, equal highs/lows.
Price moves aggressively to liquidity. Enter short with stop behind local structure, target equal lows. Risk-reward 1:3 or better.
Decreasing volume on each low indicates weakness (bullish divergence). Wait for structure breakdown.
Enter at order block, stop behind, target resistance zone. Risk-reward 1:10. Shows power of top-down analysis.
Enter short at daily order block, take profit at equal minimums. Risk-reward 1:23. Emphasizes liquidity and structure.
Erase unnecessary, identify resistance zones and equal highs (liquidity magnet). Enter on return to sideways trend, stop behind, targets at highs. Risk-reward 1:14.
Practice and clear understanding of tools are essential. Unsuccessful traders crave confidence from analysis; test on history before real account. Learn to read the market.
Proper chart analysis requires a top-down approach, starting with higher timeframes to understand the overall picture, then drilling down to lower timeframes for entry. Simplicity, patience, and a clear plan are key to profitable trading.
What is the first step in analyzing a chart according to the video?
Start with higher timeframes (monthly, weekly) and move to lower ones.
00:15
Why should you avoid staring at the chart all day?
It leads to seeing false patterns and opening losing positions.
01:09
What is the recommended daily analysis time?
Half an hour to an hour a day.
01:09
What is the role of higher timeframes in case of disagreement?
Higher timeframes always take priority.
03:11
What is the 'magnet for price' mentioned in the video?
Significant highs and lows (liquidity).
03:26
What should you do if the weekly trend disagrees with the monthly?
Rely on the monthly and wait for a test of the support zone.
04:04
What is the main purpose of minute timeframes?
Only for entering a position.
07:31
Where should you place a stop loss?
On higher timeframes behind local support or resistance zones.
08:11
What does decreasing volume on each low indicate?
Weakness of the downward movement (bullish divergence).
15:39
What is the recommended risk-reward ratio for a good trade?
Greater than 1:3.
07:18
Top-down analysis is essential
Establishes the core principle that all traders must start with higher timeframes.
00:15Avoid chart staring
Highlights a common psychological trap that leads to overtrading.
01:09News is bait
Challenges conventional reliance on news, emphasizing chart-based analysis.
02:02Liquidity as a magnet
Explains a key concept that significant highs/lows attract price.
03:26Stop loss must be reasoned
Stresses the importance of logical stop placement for risk management.
08:23Volume divergence signal
Demonstrates a practical technique for identifying trend weakness.
15:39[00:02] in this video we will talk about timeframes and how to correctly analyze a chart step by step. There are a huge number of analysis methods, but what I will tell you now is time-tested and works. With this approach, you
[00:15] will immediately see the result, and over time, when you have enough experience, you will begin to correctly and understandable trades for you. The first thing I want to tell you is the main points that you should consider in your trading,
[00:29] regardless of who you want to be or who you are. Intraday swing or positional traders, you still need to start analyzing with higher timeframes, smoothly moving to lower timeframes. This analysis is so important
[00:42] because you should always pay attention to the overall picture of the days, depending on your trading style. You also should not complicate your analysis. Strength lies in simplicity. Try to stick to the basics that you study,
[00:54] especially now when you absorb a huge amount of information about new concepts. Even if you are trying to perfect a certain complicate the process. This will only confuse you. Stop looking at the chart all the time.
[01:09] You should analyze and develop a trading plan for the day and possible scenarios. For this, half an hour or an hour a day is enough for me, pairs viewed. After that, I will place alerts in the areas of interest and
[01:23] then all that remains is to observe. I fell asleep and follow the plan. If you sit and stare at the chart day and night, simply out of boredom, you will see a path that is not really there and, therefore, you will open a losing position. Learn not to
[01:37] open trades simply because of the desire to get an adrenaline rush, to earn money right now, or simply because of your intuition. Only composure and a clear plan can be profitable over time. And remember the important point that what you earn
[01:49] today you will lose tomorrow. If there is no system, you must understand that trading is a potential earning opportunity over time. They are in the moment and this type of activity is not for everyone. You should also stop
[02:02] watching the news. This is bait for hamsters. Everything you need for accurate analysis is on the chart. I am not saying that the news cannot be traded. I have identified strategies that work great in the right context,
[02:14] but most of you will not have enough experience and knowledge for such trading. Consider manipulative tool that increases volatility, you should always prioritize higher timeframes. Proper chart analysis from top to bottom sounds
[02:29] terrible. Understanding where the price should move, where it can reverse, and what zones of interest you will have for opening positions is simple. Keep these points in mind and stick to them. Now let's talk about what we
[02:43] I made a cheat sheet like this; you can save it so you don't forget. Now we'll briefly talk about what is written here, and then I'll show a couple of examples of proper chart analysis. Let's start with the month. The first thing you need to do is analyze the
[02:58] history allows, then starting with three months. You should always remember that higher timeframes will always be a priority. When you have disagreements between timeframes, you should give preference to the higher
[03:11] timeframe for months. I look at the structure to determine market sentiment and the preferred direction for my position. Then I'll decide on liquidity. Significant highs and lows are a magnet for price. I also look at
[03:26] manipulation, this activation of 100 damaged traders by withdrawing liquidity. You can open an excellent position. To see examples of such work, you can go to my telegram channel and subscribe to it. Here I write about
[03:38] trading analytics and thoughts on the market. You will find a lot of useful and interesting information for yourself as a trader. See the link in the description. Ok, after a month, we go down to the weekly timeframe. Here I already spend
[03:51] more time than on months. The first thing you should do is look at the structure of the weekly timeframe. You will have situations when the trend is bearish on the week, bullish on the month. There is nothing wrong with this. Rely on months and it is
[04:04] quite possible that the price is moving to form a harlow. Therefore, in such cases, you need to determine the support zone for months and wait for a test. Most likely, the price will continue to move in a bullish trend. Of course, there are some nuances here and you
[04:16] also need to take into account the context, but in most cases it will be as I said. The next thing you need to do is decide on the interest where you will open your positions. You wait for the price to test a
[04:29] resistance zone. In these areas, you will work on lower timeframes. There is a video in the upper right corner in which I talked about entering a trade from lower ones. using zones of interest from higher timeframes. Watch it after this
[04:43] video if you haven't already. Then I look at where the liquidity is, similar to the monthly timeframes. But here's an important point you must understand. Your trade should be opened based on a combination of factors, and not because
[04:56] you saw liquidity was not withdrawn, so you decided to enter the bottom only when you understand that the price has reached the support zone, let's say it formed a heirloom, or there was a withdrawal of liquidity from below, and you saw
[05:09] manipulation of the bottom. Then you enter a position and determine these equal maximums and as targets for the price. There are also a lot of nuances here. This video is not about this, but even this information is enough to start trading correctly.
[05:23] Weekly, we finished the next timeframe, where again the main analysis is already being carried out on it. First of all, we look at the structure. Try to open any positions in sync with the structure of higher timeframes. Next, I recommend paying
[05:36] attention to the high and Luntik Shiva of the previous day. The price is often manipulated by these highs or Laya Dream allows you to determine further price movements within the day, and just like on the weekly On the timeframe, you must identify significant
[05:49] support and resistance zones. These will be your zones of interest that are consistent with the current trend. At this stage, I already have a clear understanding of the direction of my trades and I have already marked the zones of interest where I will look for entry points
[06:02] on lower timeframes. After that, there are hourly timeframes, this is the timeframe from an hour to 12 hours. The same hierarchy works here. We look at the 12-hour graphics, then
[06:14] switch to 4 hours, then to an hour, this is the main timeframe. In addition to the voiced timeframes, you can view 2 hours and 8 hours, and so on, if you need it. The first thing we do is determine the current structure. You
[06:27] should always try to find synchronicity with high timeframes for a greater likelihood of working out your trade. In the zones of interest that we identified on higher timeframes, the game enters the bikes. Look for manipulation of swarms in
[06:40] support zones and there, look at local institutional candles from where you can enter with a short stop. In resistance zones, accordingly, look at the manipulation of highs. If You haven't seen my Wayto videos yet. The photo is now
[06:53] a tip. Watch. Part 2 will be out soon. Just don't think that Baikov should always be used and look for accumulations or distributions in every sideways movement. No, that's not true. You can certainly do that, but I don't see the point. You should
[07:06] rely on other factors. Baikov can tell you about the future price direction in synchronicity with higher timeframes. At this stage, you can safely trade using such simple analysis and your trades will be
[07:18] effective and correct. But this is more suitable for swing traders. I like to enter with a fairly short stop. The risk-reward ratio is greater than three, so let's move on to the moon. Yes, and the frame will always be used only
[07:31] for entering a position. Minute charts are considered lower timeframes. Everything below an hour is on the screen. You see the main timeframes that I personally use. Sometimes I look at others when I need to. So, you need to understand that you
[07:45] switch to these timeframes only when the price is in yours. their interests, that is, all the analysis that you conducted on the previous timeframes is combined. Don't make obvious mistakes that I often see. First, don't
[07:58] open trades if the price hasn't reached your zone of interest. Most likely, as usual, you're in too much of a hurry. As a result, the price will reach where you need it, but by that point, you'll already have several stops behind you. Second, if you switch
[08:11] to lower timeframes to look for an entry to stop, also place it on lower timeframes behind local support or resistance zones from the elf. Set it on a higher timeframe, so you'll already have a good risk-reward ratio.
[08:23] Third, don't place a stop loss in the air. The market doesn't care about your plans. A stop loss should always be reasoned. Then your trading can potentially be profitable over time. This means that if you have an
[08:36] uptrend and the price is testing the support zone that you identified on higher timeframes, you should look at the langauge in this zone. Learn to use it on and free trades. We're right on lower timeframes. You should also look at the
[08:49] structure, as everywhere else. This can help you open a position in the zone of interest when The move toward the global trend. You should also always watch for manipulation. This will be your signal of where the price is most likely to go, and you will
[09:04] understand if there is potential for a reversal from your zone of interest. And if desired, all the tools work down to the second timeframe. Perhaps it is precisely according to see confirmations, and you will be able to open profitable trades with a good
[09:18] risk-reward ratio on the R.R. account. You should always be aware that not every opportunity should be immediately realized. If the risk- reward ratio does not suit you and does not correspond to your trading strategy, it
[09:31] would be right to skip this and wait for better opportunities. Learn If you do not open a position now, there will be many more opportunities in the future, and there may be much more significant factors and a better
[09:44] risk-reward ratio. If you want a video about risk management, write about it in the comments, and then it will be released in the near future. So now let's move on to a real example. We will analyze the euro-dollar chart, since currency pairs have
[09:57] much more information on a monthly timeframe than on crypto. Everything that will be said below can be applied to any market, whether stock or crypto. Let's begin the analysis of the monthly timeframe again. Here it is clearly visible that the price
[10:09] has begun to move in a downward direction, creating lower minimums and maximums. We only pay attention to the ho and lo. After an impulsive downward movement, the price began to break away in a sideways trend, immediately
[10:21] determining the minimums and maximums that the price is most likely to manipulate and marked the lower and upper boundaries of the range. There is a large amount of liquidity there and there, which means we will be able to open a deal in the
[10:34] opposite direction after removing the stop-loss in the SS on one of the sides if there are enough factors for this. I also determine obvious resistance and support zones. Zone 1 and resistance will be this minimum. This is a
[10:46] minimum. This is a time frame. Now I switch to the weekly time frame. Here I may only be interested in this internal sideways trend. I answer bearish ultrabook from which the
[10:59] answer bearish ultrabook from which the price has already reacted. Therefore, if the price will most likely go to remove the liquidity from the strange minimum. We look at the structure. We see that the price moved correctively in a bullish trend in the
[11:12] resistance zone. Let's look at divergences as a factor. There is a hidden bearish divergence. Considering the above factors, this is already a good reason to look for a position from the border
[11:24] block. Considering that the general direction of the asset in recent years has been downwards, therefore, already on the weekly time frame we understand where the price should move and where it will start its movement. Now we are waiting for a breakdown of the structure and When the
[11:37] trend changes, you can consider a short position on the formation of laurels, and in addition to these equal minimums, we can mark the minimum and above where we can partially fix our short position. Here I mark the equal minimum and after
[11:50] will reverse and go for a correction. The next thing we do is switch to a lower timeframe on the daily chart. The first thing you need to do is look at the structure. I will not change anything here because the
[12:03] weekly structure corresponds to the current timeframe, determining potential support and resistance zones. I mark the support zone, broken understanding of this tool and would never have seen that
[12:16] its face is defined this way, but the only thing I can say is that you should test the tools and absorb the correct information, not what you googled or saw somewhere in the chat. With an understanding of the logic of the tool, you will be able not only to
[12:29] mark specific zones, but also trade profitably. Well, okay, let's continue further. I mark the potential resistance areas that will interest me after the conditional structure of a bearish arterial block in the ATO zone and another one
[12:42] above which We've already tested it, but perhaps the price will re-read, so I'm noting that's all I needed. Next, let's move to the hourly Next, let's move to the hourly timeframe and start with 12 hours.
[12:54] interesting to hear his opinion on opening any positions, given the macro situation below. We also see a bullish trend in depth, from which there will likely be some kind of reaction, and perhaps the price will test it and go for a correction. We also see
[13:09] that the price has begun to form a lawyer Louis Louvre high, a descending structure has emerged. That's all we needed on this timeframe. Now let's switch to the 4- hour VIC. Here, the entire important zone of interest is already highlighted, and in this situation, there's
[13:22] nothing to do except mark a local blue order, in which the price can form a sideways trend or simply go for a higher correction. We'll finish with the next hourly VIC timeframe here.
[13:35] our zone of interest for 4 hours. We see that the price is being manipulated by highs, this will be a sign of an ARI distribution along Valkov, and a sideways trend has formed here. We note the equal highs and lows that the price can possibly manipulate. We also
[13:49] see that we have liquidity from below. The price cannot consolidate below and returns obvious targets for the price, which are these equal highs. Watch my previous video in which I talk about the basics about liquidity
[14:03] for a better understanding of the material. We can also potentially open a position here on a given timeframe and place a stop behind this minimum with targets. The Let's try this. A position will be opened here, a stop here, a target here. Okay, the
[14:18] risk-reward ratio of one to three is not the best example, but one to three is not the best example, but acceptable. Let's see what happens. The price What do we see here? The same situation is open. We open a similar deal,
[14:32] only in the other direction. We set an entry of 105 kg. We are already placing it on higher timeframes. This will be the minimum, which, when updated, will break the local path. The entire structure of the risk-reward ratio is 113, and this is already not bad. Well, let
[14:45] 's see how the price works out. The price begins to move aggressively, clearly towards our minimum. This is all about liquidity. and you must understand that I will not consider minute timeframes because I have already posted a video on this topic, look at
[14:57] the tips, let's switch to 4 hours to make it more comfortable to look at development of the support and resistance zones that I noted, perhaps we will enter a position on paper if there are a sufficient number of factors, okay,
[15:12] the price goes beyond the marked bar and consolidates below it, this will be a signal that it is quite likely that our bearish trend will continue, we need to will enter a position, the price tested the support zone that we
[15:26] noted on the daily timeframe, we also see the manipulation of the bar me now we look at the volume and see that with each updated me the volume decreased, which indicates the weakness of the downward movement, this is a bullish divergence, so
[15:39] now we are waiting for a breakdown of the structure and we will move on the same timeframe. I want to show that with proper analysis, the tools work on all timeframes positions with a high ratio of Odessa profit, noting the maximum where the elephant of the
[15:53] structure will be and the formed pipe is also visible which is located in the zone y i.e. enter here, since I am not going to switch to another timeframe and I will simply place a stop here for this order. And so we place it on the
[16:08] resistance zone that we identified above oil. The risk/reward ratio is 1:10. Very good potential. Please note that I have easy for me to determine further price movement. There are many complications in finding a trade with a
[16:23] good risk/reward ratio. The price tests very nicely. Your true block is highlighted. It starts to fly up and stops at the daily interest zone for opening short positions. We change clothes and now the Finn short, but
[16:36] reached this area. We need the appropriate factors that I have already begins to trade sideways. We see an update. Here,
[16:48] the price could not gain a foothold and went back into the range. Then we see another Perry high as an additional factor. Let's look at the volume. Here, we see the weakness of the bullish trend. Remember, if you
[17:01] see manipulation of highs in the resistance zone, then this is A very good sign for opening a position, especially considering the higher timeframes in this example. Okay, I like this area for opening a position. I would enter now to place a bet on the daily
[17:13] IRI IR BUK option to bypass the mass. You can wait for a breakdown of the local structure, for example, on the hourly charts and go for the formation of a Louvre X, or wait until the price updates the minimum from which this upward impulse was formed
[17:26] and then also for the formation of a Louvre. Okay, here I set an entry stop order block and take profit at equal minimums below those we determined at the very beginning. This will be a swing position. Here the risk/reward ratio is 1.23. Very
[17:40] good. I turn on the daily timeframe and watch the process. You can stop the video and watch how the highlighted support zones will work out. I will not analyze each rebound because the logic here is absolutely the same. A
[17:54] well-developed trade. Here we focused mainly on liquidity and structure. Now we will consider the break in the position. We look at the manipulation of Miami and will enter and, naturally, on lower timeframes you will have There are
[18:06] many more possibilities, but I don't want to drag out this video too much. The main goal is to show that analysis, and a higher timeframe will always be a With this approach, you will at least learn to understand the market a little and open the
[18:18] right positions. Let's start by erasing everything unnecessary. We'll remember where the first resistance zone is for a month, but nothing has changed. And the medications block. Let's repeat the same thing we did at the very beginning. We define
[18:32] significant highs and intermediate targets for the price. Here we see equal highs. Behind them is a huge amount of liquidity. This will be a magnet for the price. It determines resistance zones within this sideways trend. I won't do this anymore, since the
[18:45] only logical place where the algorithms will move the price has already been highlighted. Entry into a position can be done in different ways. I've already shown how to do this on different timeframes. So, I switch to the
[18:57] daily chart and will enter when the price returns back to the sideways trend. Here we see something similar to 3taps. And yes, I enter the absorption, even despite the lower timeframes, the context allows this. Here I have a stop here, I'll
[19:10] put it behind this layer in the compartment. We have already defined the main goal. This purple area, but I will also fix my profit at these highs, and most likely, for most of the positions, so in this deal, the risk-
[19:24] reward ratio of 114 will do. This is necessary to show that analysis from higher timeframes allows you to understand where the price will move next, and how you open trades directly depends on your trading style. Okay, let's
[19:38] look at the performance. The price initially moved in our direction, but then tested the resistance zone and began to move even lower. No big deal. We saw a 3rd break and the price returned back. A favorable range is
[19:50] long. Also, as an additional factor for entering a trade without confirmation, I'm looking at the RCN indicator. We see a discrepancy between the chart and the indicator. This will be a bullish divergence. Mook Perry. We enter the position immediately and bet 100
[20:05] for the lowest minimum at the same rate. The potential of this position is much greater here. The risk-reward ratio is 1.25 before and after we saw another straight line. The probability of opening a profitable position is much higher now. I'll
[20:19] open a monthly chart. We'll look at the performance, but for now, let's summarize. In summary, to correctly analyze a chart from top to bottom, you need practice and a clear understanding of the tools, otherwise you will see things that are simply not what you
[20:32] think. Why are unsuccessful traders obsessed with market analysis? Because they crave a feeling of confidence, and they think that analysis gives them this feeling. It is true that the typical trader wants to be right in every
[20:45] trade; he desperately tries to create confidence where there simply is none. I test everything on history, and only then, when you have confidence in your analysis, begin to apply it all to a real account. Learn to read the market.
[20:59] Charts provide a huge amount of information, and it will be practice itself. You may have noticed that the price has approached our resistance zone. Now you should determine targets for the price below on a higher timeframe and gradually
[21:11] switch to lower ones, analyzing the chart in the same way as we did. Then I would look for a short to this support zone from it from a cleaver. What simple logic is that's all. If you have any questions, write in
[21:25] something new, show feedback, like it, write a comment. This write a comment. This helps promote the video.
⚡ Saved you 0h 21m reading this? Transcribe any YouTube video for free — no signup needed.