
The WORST Way to Trade Fractals
45sChallenges a common beginner strategy, creating curiosity and potential debate.
▶ Play Clip"Delivers on the promise with two concrete strategies, but the 'BEST' claim is subjective and the video includes a standard subscribe plug."
The video presents two trading strategies using the Williams Fractal indicator, emphasizing a breakout approach over the commonly used reversal method. It also covers adjusting the indicator's settings on TradingView and combining fractals with the Stochastic RSI for trend trading.
The Williams Fractal is a simple indicator that reveals potential support and resistance levels. A top fractal indicates potential resistance, while a bottom fractal indicates potential support.
A top fractal appears when the highs of the two candles on each side do not overlap the high of the middle candle. Similarly, a bottom fractal appears when the lows of the surrounding candles do not overlap the low of the middle candle. Fractals appear two candles after the pattern is confirmed.
The built-in Williams Fractal on TradingView gives too many signals and cannot be customized. The presenter recommends using the 'Simple Crypto' version, which allows changing the range setting from 5 to 9 to filter out noise.
Using fractals as a reversal indicator (buying at bottom fractals, selling at top fractals) is the worst way to trade, as backtesting showed a very low win rate.
The effective strategy is to use fractals as breakout signals. When price is above the 200 EMA, only take buy signals from top fractals; when below, only take sell signals from bottom fractals.
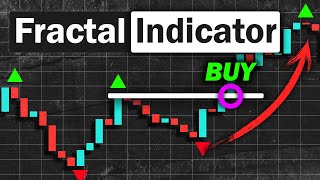
For a buy: wait for the closing price to break above the latest top fractal, then enter a buy position. For a sell: wait for the closing price to break below the latest bottom fractal, then enter a sell position.
Place stop loss below (for buys) or above (for sells) the entry candle. Set profit target at 1.5 times the stop loss distance.
Combine fractals with Stochastic RSI and the Alligator indicator. Trade only in trending markets (Alligator lines aligned). In an uptrend, buy when a bottom fractal appears and Stochastic RSI is oversold; in a downtrend, sell when a top fractal appears and Stochastic RSI is overbought.
Place stop loss below (for buys) or above (for sells) the fractal candle. Take profit when a candle closes at the pink line (likely the Alligator's teeth or a moving average).
The video provides two practical fractal trading strategies: a breakout strategy using the 200 EMA and a trend-following strategy combining fractals with Stochastic RSI and the Alligator. Both emphasize filtering signals and using proper risk management.
What does a top fractal indicate?
A potential resistance level.
00:17
How is a top fractal formed?
When the highs of the two candles on each side do not overlap the high of the middle candle.
00:44
Why does the presenter recommend changing the range setting to 9?
To filter out unnecessary fractals and leave only the main ones, making it easier to trade.
01:41
What is the worst way to trade fractals according to the presenter?
Using them as a reversal indicator (buying at bottom fractals, selling at top fractals).
02:11
In the breakout strategy, when do you take buy signals?
When the price is above the 200 EMA, take buy signals from top fractals.
02:52
What is the exit strategy for the breakout strategy?
Place stop loss below (for buys) or above (for sells) the entry candle, and set profit target at 1.5 times the stop loss.
04:06
What indicators are combined in the bonus strategy?
Williams Fractal, Stochastic RSI, and Alligator.
05:34
When do you take a buy signal in the bonus strategy?
When the market is in an uptrend (Alligator lines aligned upwards) and a bottom fractal appears while Stochastic RSI is oversold.
06:29
Reversal strategy debunked
Challenges a common beginner approach with backtesting evidence, saving traders from a losing strategy.
02:11Breakout strategy as the effective alternative
Provides a proven alternative that aligns with trend-following principles, increasing win rate.
02:39Customizing fractal range to 9
A simple tweak that drastically reduces noise, improving signal clarity.
01:41Combining fractal with Stochastic RSI
Shows how to filter fractal signals with an oscillator, enhancing entry timing.
05:34[00:02] strategy that you can use with the Williams Fractal indicator. So, without further ado, let's get on with the video. The Williams Fractal or the Fractal is a very simple and useful indicator. It can
[00:17] help you make your job a lot easier by revealing important price levels on the revealing important price levels on the market. And how it works is very simple. If a top Fractal appeared, it indicates that the level can be a potential
[00:29] resistance. And if a bottom Fractal appeared, it potential support. So, how does the Fractal determine the key levels? Basically, how it works is that a top
[00:44] Fractal will appear if the other four candles on the sides doesn't overlap the highs of the middle candle. And a bottom Fractal will appear if the other four candles on the sides doesn't overlap the lows of the middle candle.
[01:00] So, that is why if you look at the price real time, a Fractal will only appear behind two candles after they were closed. Now, the biggest problem with the Fractal indicator is that it is giving
[01:12] too many signals, which makes it confusing and hard to trade. And if you're using the built-in version of the Williams Fractal on TradingView, you cannot change any of the settings. So, instead, I suggest using this one. It is
[01:27] Simple Crypto. because you can actually change the settings. So, first, we turn off all the unnecessary lines. Next, go to inputs.
[01:41] And here, we can actually change the value of the range. I like to change this from five to nine. So, now a Fractal will only appear at the highs or lows of nine candles instead of the default settings, which is only at five
[01:56] candles. And now you can actually see that most of the unnecessary fractals have been removed, leaving only the main ones, hence making it easier to trade. One of the most famous strategy that beginners use when trading the fractal
[02:11] is by using it as a reversal indicator. So, when a bottom fractal appears, they open a buy position hoping that the price will reverse upwards. And when a top fractal appears, they open a sell position hoping that the
[02:25] price will reverse downwards. Well, after back testing the strategy multiple times, I discovered that this is actually the worst way of trading the fractal. It gave a very low win rate and the strategy doesn't even work.
[02:39] However, after testing multiple types of fractal strategies, I actually found one that works. And that is by using it as a breakout strategy. So, this is how the strategy works.
[02:52] First of all, I'm going to be using the 200 EMA to identify the long-term trend. So, if the price is above the 200 EMA, fractal. And if the price is below the 200 EMA,
[03:07] you only take signals from the bottom fractal. Now, for this explanation, let's say that the price is above the 200 EMA. So, the first step is you want to look at the latest top fractal that appeared.
[03:23] Then, you want to wait for the closing price to break out above that top fractal. Once this happens, you take a buy position. It's the same for sell positions as
[03:36] well. Let's say that the price is below the 200 EMA, meaning you only focus on the bottom fractal. So, first, you want to look at the latest bottom fractal that appeared. Then, you wait for the closing price to
[03:50] break out below that bottom fractal. Once this happens, you take a sell position. Now, let's discuss our exit strategy. So, let's say you took a buy position here. For your stop loss, you place it
[04:06] below your entry candle, and for your profit target, you set it at 1.5 times your stop loss. So, here's an example of the strategy in action. In this chart, we can see that the price is above the 200 EMA, and so
[04:21] you want to look at the latest top fractal that appeared. Next, you wait for a candle to close and break out above the top fractal. Once this happens, you take a buy position. Next, you place your stop loss
[04:36] below your entry candle, and set your profit target at 1.5 times your stop loss. And as you can see, the price hits our profit target, so this counts as a successful trade. Let's look at another example.
[04:51] In this chart, we can see that the price is below the 200 EMA, and so you want to look at the latest bottom fractal that appeared. Then, you wait for a candle to close and break out below the fractal candle. Once
[05:05] this happens, you take a sell position. Then, you place your stop loss above your entry candle, and set your profit target at 1.5 times your stop loss. And as you can see,
[05:19] this trade ended up being profitable. And that's how you trade the fractal as a breakout strategy. Now, as a bonus, I'm going to show you another way of trading the fractal, and that is by combining the fractal
[05:34] RSI. So, this is how the strategy works. First, we only want to trade on a trending market. This can be identified by looking at the alligator. All three lines needs to be heading in the same
[05:48] direction and are also separated from each other like this. If all the lines are heading upwards, it indicates that the market is on an signals. And if all the lines are heading
[06:01] downwards, it indicates that the market is on a downtrend, meaning we only take sell signals. Remember, we want to avoid ranging markets that have no clear direction, which can be identified by the lines
[06:14] crossing multiple times in the middle like this. So, once you've identified a trend, the next step is finding our entry signal. If the market is on an uptrend and the bottom fractal appeared while
[06:29] and the bottom fractal appeared while the Stochastic RSI is at oversold, you take a buy position. Now, for your stop loss, you place it Now, for your stop loss, you place it below your fractal candle here.
[06:41] well. If the market is on a downtrend and the top fractal appeared while the Stochastic RSI is at overbought, you take a sell position. Now, for your stop loss, you place it
[06:55] Now, for your stop loss, you place it above the fractal candle. close your trade and take profit when a candle closes at the pink line. action. In this chart, we can see that the price
[07:11] alligator. Next, we can see that a bottom fractal appeared, but the Stochastic isn't at oversold yet, meaning you ignore this signal.
[07:24] Next, you can see that another bottom fractal has appeared, but this time the Stochastic is at oversold. So, this will be our entry signal and you want to take a buy position.
[07:37] Then, you place your stop loss below the fractal and take profits when a candle closes at the pink line. And as you can see, this trade ended up being profitable. Let's look at another example.
[07:53] In this chart, we can see that the price is on a downtrend as indicated by the Then, we can see that a top fractal appeared and the stochastics is at the overbought levels.
[08:06] So, this will be our entry signal and you want to take a sell position. Then, you set up your stop loss at the top fractal and take profits when the price hits the pink line. And as you can see,
[08:20] the price hits our profit target and so this counts as a successful trade. So, I just revealed two Williams fractal strategies that you can immediately implement in your trading system right now. And all I ask for in return is for
[08:36] into liking the video and subscribe to the channel. It literally takes only two clicks, but it means a lot to me. And you can also check out my other videos So, thank you guys for watching and I'll see you in the next video.




⚡ Saved you 0h 08m reading this? Transcribe any YouTube video for free — no signup needed.