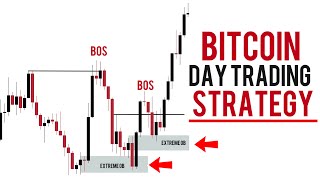

Bitcoin's Secret Supply & Demand Structure
45sTeaches a clear, repeatable pattern that traders can apply immediately, making it highly educational and shareable.
▶ Play Clip"The title promises a step-by-step institutional strategy, and the video delivers a structured method with clear examples."
This video explains how to trade Bitcoin using Smart Money Concepts, focusing on supply and demand structures, support and resistance, and Fibonacci levels to identify discount and premium zones for entries and exits.
Bitcoin price breaks structure, comes back inside the range, reaches for a demand point, breaks the range, and repeats this pattern.
Supply and demand structure involves price breaking a range and retracing deep; support/resistance structure involves price breaking a range but not retracing deep, retracing to the point of the shelf.
A range is defined by a swing high and swing low. When price breaks a swing high and comes back inside, that new high becomes the top, and the swing low that forced the move becomes the bottom.
Use Fibonacci levels 0.25, 0.5, 0.75, 1.0. The bottom quarter is discount (best to buy), top quarter is premium (best to sell).
For Bitcoin, the 8-hour time frame is used to see swings clearly. Lower time frames add more wicks and micro swings, which should be eliminated.
The strategy is reactive: wait for price to break structure, retrace to discount, then enter. No guesswork.
After price breaks structure and retraces inside the range, use Fibonacci from swing low to swing high, wait for price to reach discount, enter with stop loss below the extreme level, first target previous range, second target clearing liquidity.
When volume increases, price moves faster. Lower the time frame (e.g., from 8H to 4H to 1H) to see structure clearly and find ranges.
Sometimes price reacts at the 50% Fibonacci level instead of the extreme discount. This is a common entry point.
The key to trading Bitcoin with Smart Money Concepts is to wait for price to break structure, retrace to a discount zone (extreme or 50% level), and then enter with a clear stop loss and targets. Patience and reacting to price action are crucial.
What is the difference between supply/demand structure and support/resistance structure?
Supply/demand: price breaks range and retraces deep. Support/resistance: price breaks range but does not retrace deep, retraces to the point of the shelf.
00:27
How do you define a range in Smart Money Concepts?
A range is defined by a swing high and swing low. When price breaks a swing high and comes back inside, that new high is the top, and the swing low that forced the move is the bottom.
01:09
What Fibonacci levels are used to identify discount and premium zones?
0.25, 0.5, 0.75, 1.0. Bottom quarter (0-0.25) is discount, top quarter (0.75-1.0) is premium.
02:07
What is the recommended operating time frame for Bitcoin according to the video?
The 8-hour time frame is recommended to see swings clearly without micro swings.
03:03
What should you do when volume increases and price moves faster?
Lower the time frame (e.g., from 8H to 4H to 1H) to see structure clearly and find ranges.
08:57
What is the '50% trade'?
When price reacts at the 50% Fibonacci level instead of the extreme discount, providing an entry point.
13:04
Where should you place your stop loss in this strategy?
Below the extreme level (origin of the move) or below the swing low/high that defines the discount zone.
06:08
What are the typical target levels (TP1 and TP2) in this strategy?
TP1 is the previous range high/low, TP2 is clearing liquidity beyond that.
06:08
Bitcoin's Supply and Demand Profile
Explains the core pattern of Bitcoin price movement, which is foundational to the strategy.
00:01Fibonacci Discount and Premium Zones
Provides a clear, quantifiable method for identifying entry and exit zones.
02:07Reactive Trading vs Anticipation
Emphasizes patience and waiting for confirmation, a key principle for disciplined trading.
04:08Adjusting Time Frames for Volume
Offers a practical solution for adapting to changing market conditions.
08:57The 50% Trade
Highlights a common alternative entry point, increasing flexibility.
13:04[00:01] about how to use Smart money Concepts while trading Bitcoin first thing you must know is Bitcoin moves in a supply and demand structure price break structure comes back inside of the range reaches for a
[00:14] demand point breaks the range comes back inside of the range breaks the range and so on so on this is the profile which Bitcoin moves in when it comes to the million times but let's do it real quick so supply and demand structure would be
[00:27] price breaking the range and retracing back deep breaking a range retracing back deep a support and resistance structure would be something like this where price forms a range break structure but does not retrace deep
[00:40] retrace up to the point of your shelf and expands retrace to the point of the shelf right here or a little bit right here and expands so now this is your supply and demand structure and this is your support and resistance structure so
[00:56] in case you're confused what a range is you have your swing high right here once price breaks That Swing high and price comes back inside of the range price comes back inside of the range that new high is the top so this will be
[01:09] the top of your range and That Swing Low that forced this move would be the bottom of your range so now you have your swing low and swing High which your swing low and swing High which formed your
[01:22] discount levels so now that you understand what a range is let's take it a step further so you have your swing high price break structure and comes back inside of previous range so what is our current range now it would be our
[01:40] swing high and swing low what validated the swing high was price coming back into a previous
[01:53] swing high so now what you want to do is you want to pull out your fib
[02:07] 025 05751 so basically it's quarters your bottom quarter is your discount your top quarter is your premium so think of it
[02:19] like this price is best sold at this area and best bought at this area it's best to buy price here and it's best to sell buy price here and it's best to sell price here that's how you think of
[02:37] comes to this specific approach when it comes to bitcoin we are looking for Price let's say this is a bullish cycle we're looking to purchase price right down here for us to purchase price here with our stop loss a little bit below
[02:51] the range and then when price come back inside of the range we're looking to take price up and so on so on before you proceed please make sure you like the video leave a comment and
[03:03] completely unmonetized so first thing you want to do is you want to locate your operating time range and in this case Bitcoin is moving in the 8 hour structure goes and if you want more information make sure you visit our
[03:16] website we covered this in great detail but the main concept is it's a time frame where you can see the swings clearly so in this case we're picking The 8 Hour you could also use the 6 hour but then it adds it
[03:29] adds more Wicks to the situation and it adds more micro swings we want to eliminate these micro swings and we really want to focus on our macro swings where we can see structure clearly so what is happening
[03:41] here we had a range right here always look to the left for
[03:53] swing low here price broke structure came back inside of the range but did not retrace deep inside our Discounter level and came down so what are we anticipating now right now if you open the chart and this is what you see
[04:08] because like I said previously we are strictly looking at discounted and premium levels right and what we want now is for price to break structure here retrace and hopefully come back to our discount and continue dropping and if
[04:23] a change of character which is a reversal which I obviously made me reversal which I obviously made me lessons on before so let's say
[04:35] finds resistance and them break structure then we're simply looking for a break back inside of the range to take it long to continue with our macro Trend so we're really reacting we're not anticipating price we're not playing any
[04:49] guess work we're waiting for the correct setup when it comes to structure price did not break structure price react from a extreme demand level
[05:01] this would be our extreme demand level and this would be our extreme Supply our extreme demand level so more than likely price will break structure and continuation entries when it comes to bitcoin but for right now let's just
[05:16] focus on this simple entry so let's see price break price break structure okay did price break structure structure okay did price break structure let's zoom in
[05:35] so let's wait okay now price broke structure so let's see if price comes back inside of the range price is rejecting from the
[05:48] the range so what do we do now you pull out your FIB swing low now you pull out your FIB swing low swing high and we are waiting for an swing high and we are waiting for an entry right here
[06:08] with our entry being right here and our stop loss being right below this swing the origin of our extreme level and we're taking price and our first DP back to our previous range
[06:24] our first DP back to our previous range and then our second CP would be clearing and then our second CP would be clearing this liquidity right here
[06:39] reaction let's see if we can get a one to one then go to break this is the entry that you want to focus on so let's carry
[06:54] on let's delete everything and start again to keep it clear so what happened we had our previous range always look back always retrace your steps especially if you're a beginner so we had a break of structure
[07:08] P price came back to the extreme and reacted so now what is our current range our current range is our current range is this swing high and this swing low and let me make it even a bit easier for you if you go into
[07:24] a 12h hour you could even see it at a better point can go on The Daily and you can see the even clear but let's stay on the 8 hour so let's see if
[07:36] price retraces back price already retraced back without giving us that much time this was our swing high is our extreme level right here and where are we trying to take price we're trying to
[07:51] take price back up here as our first CP then our second TP right here of of course your initial reaction your first TP as far as when you move
[08:04] your uh stop loss to break even would already been hit because price reacted from this level and your stop loss is right here and you can go to break even right here but then price will return back and take you out of your position
[08:16] the way you move your stop loss this is if you want to be extremely extremely if you want to be extremely extremely conservative with your stop
[08:28] loss okay now now our first TP hit let's see if we can get our second
[08:42] what would you do right here obviously this price action is completely more structural and this is more expansive what happened here obviously the best thing to do is to practice patience to wait for the easy setups
[08:57] like these setups right here like these extreme setups like price breaking price breaking structure coming back inside of the range but if you are a scalper what happened here is there was more volume so what happens when there's
[09:12] more volume that means price moves faster obviously if you ignore the the whole uh candle aspect of things and if you just strictly look at it from a price point if you look at it from a number standpoint you can see that price
[09:28] moves bare number and what you can see here is the fact that price moved a lot previously that means there was more volume injected more volume injected price moves faster price reaches a higher price point so Bitcoin now is at
[09:43] 47 but when this cycle first started was at 43 so it moved from 43 to 47 in literally two days actually a day and a half so that means there was a lot more volume and we can anticipate the the higher volume to continue so when you do
[09:57] have higher volume which you is your operating time frame changes and I explained this on the website so what you do here is you lower your time frame until you can see structure so you can go from 8 hour to the 4 Hour you still
[10:10] to the 1 hour now you're starting to see structure so now you can start looking for your range and again this this entire this entire motion right here this entire multiple micro structure
[10:24] swings if you go back on our operating time frame of previous which was The 8 you do is you lower your time frame once you lower your time frame you can now you lower your time frame you can now start looking for ranges so let's take a
[10:42] look so now let's take a look what do we have here we have a we can even go a bit lower going to 30 minutes this is your swing high this is
[10:57] minutes this is your swing high this is your swing low reacting from an extreme level we can anticipate price to reach this level and
[11:09] anticipate price to reach this level and therefore on see okay price broke structure and now price is coming back again inside of the range so now what do you do now swing low swing high it's just as simple as
[11:25] that you don't want to over complicate anything if you guys want more lessons always do that but first thing you must do is understand the
[11:38] are waiting for price to reach this level right here and once price reaches this level right here we're trying to take it back above the
[11:54] range price is reacting from our extreme level now we can erase this now price is level now we can erase this now price is reacting from our extreme level in the advanced version when price consolidates after your reaction that's
[12:09] not a good sign usually but let's continue we still anticipate price to continue we still anticipate price to break this
[12:23] not breaking but got close so let's carry on okay so now we can go back on the 1 hour and what do we have here we have our swing low right
[12:40] our swing low right here and we have this previous swing so once price comes back inside of the range we can start looking at this
[12:52] level we can start looking at this level which would be our extreme
[13:04] didn't and that'll happen not every time price will reach this level and give you an easy trade sometimes it gives people the 50% trade the 50% trade is when you pull out your fib and price reaches the 50% point that does happen quite often
[13:19] 50% point that does happen quite often too as you can see here this is the 50% Line This is the 50% line price reacted of the 50%
[13:36] line so let's carry on what do we have here let's stay on the 1 hour until we can see a major
[13:51] here your swing High swing low right here so what you're anticipating now is here so what you're anticipating now is for price to come down right
[14:06] so let's carry on what is our range swing low swing High let's see if price comes back inside of this range price came back inside of this
[14:20] range see if it'll reach our level and it did so price did reach our discount we're taking price back out outside of the
[14:39] lesson make sure you like share and subscribe and if you guys want more videos on crypto and Bitcoin trading let me know in the comments
⚡ Saved you 0h 14m reading this? Transcribe any YouTube video for free — no signup needed.