AI Summary
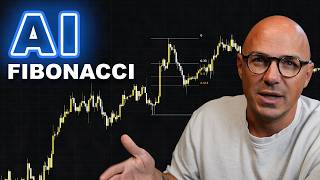
This video documents an experiment to determine whether AI can automate a manual Fibonacci retracement trading strategy. The creator, a manual trader, attempts to translate his subjective chart-reading process into exact rules for an AI to execute, testing the resulting strategy on historical EuroUSD data.
Chapters
The creator wonders if he can teach AI to trade Fibonacci the way he does manually, not just by applying the tool to every swing, but by identifying the specific moves that matter and waiting for the retracement he would trade.
The creator believes Fibonacci is better suited for manual trading because his eyes recognize context (bearish structure, impulse moves) that is hard to explain mathematically to a computer.
The AI wrote hundreds of Python scripts, tested thousands of historical structures, changed the impulse definition 600 times, and tested different Fibonacci retracements. The strategy was converted into a TradingView strategy and then an MT5 expert advisor.
The creator warns against overfitting by changing parameters until a backtest looks amazing. Instead, he asked AI to identify what separates working Fibonacci setups from failing ones.
The strongest differentiator was the size of the impulse relative to market volatility (ATR). Setups following unusually large impulse moves performed substantially better, specifically when the impulse was roughly five times the recent ATR.
The AI tested surrounding values to avoid a 'perfect historical number.' The effect persisted across a broad range (5-6x ATR), so the rule was frozen at 5x ATR with no further optimization.
Testing EuroUSD 5-minute from Jan 1, 2020 to Aug 2026: 80 trades, 26 winners (32.5% win rate), average winner $28.88, average loser $6.71, total profit $388 with 0.1 lot, profit factor 2.07.
The strategy was profitable in all seven calendar years (2020-2026), with profit factors ranging from 1.3 to 3.1, averaging 2.05. This suggests the edge is not dependent on one specific year.
The creator notes that 80 trades over six years is roughly one trade per month, and some years had very few trades (e.g., 2024 had only 5). This is not enough evidence to declare victory.
The creator still believes manual trading is better suited for this style, but the experiment is ongoing. Part two will test nearby ATR requirements, look at more historical data, and try to increase trade frequency without destroying the edge.
The experiment shows that AI can partially replicate a manual Fibonacci strategy, but the sample size is too small to confirm a real edge. The creator remains skeptical and plans further testing in part two.
Mentioned in this Video
Study Flashcards (10)
What was the key differentiator between successful and unsuccessful Fibonacci setups?
medium
Click to reveal answer
What was the key differentiator between successful and unsuccessful Fibonacci setups?
The size of the impulse relative to market volatility (ATR).
02:27
What ATR threshold was used for the impulse rule?
medium
Click to reveal answer
What ATR threshold was used for the impulse rule?
At least 5 times the 14-period ATR.
03:31
What was the win rate of the backtest?
easy
Click to reveal answer
What was the win rate of the backtest?
32.5% (26 winners out of 80 trades).
03:57
What was the profit factor of the backtest?
easy
Click to reveal answer
What was the profit factor of the backtest?
2.07.
04:24
How many trades were taken in the backtest?
easy
Click to reveal answer
How many trades were taken in the backtest?
80 trades over more than six years.
05:22
Why did the creator avoid optimizing the ATR threshold?
medium
Click to reveal answer
Why did the creator avoid optimizing the ATR threshold?
To avoid overfitting to historical data.
03:06
What was the average winning trade size?
medium
Click to reveal answer
What was the average winning trade size?
$28.88.
04:11
What was the average losing trade size?
medium
Click to reveal answer
What was the average losing trade size?
$6.71.
04:11
How many years were profitable in the backtest?
medium
Click to reveal answer
How many years were profitable in the backtest?
All seven years (2020-2026).
04:50
What is the main limitation of the backtest results?
medium
Click to reveal answer
What is the main limitation of the backtest results?
The small sample size (80 trades) is not enough evidence to declare victory.
05:35
💡 Key Takeaways
Impulse size relative to volatility is key
This is a novel, data-driven insight that could improve Fibonacci trading strategies.
02:27Avoiding overfitting through validation
The creator demonstrates a rigorous approach to prevent curve-fitting, a common pitfall in trading.
03:18Consistent profitability across years
Seven consecutive profitable years suggests the edge is not dependent on a single market condition.
04:50Small sample size limits confidence
Honest acknowledgment of the limitations of the backtest, highlighting the need for more data.
05:22Full Transcript
[00:01] retracement strategy for years. And recently, I started wondering something. Could I teach AI to trade Fibonacci the same way that I see it, not just slap a Fibonacci tool on every swing high and swing low. I mean, actually look at the
[00:15] matters, wait for the retracement I would personally trade, and then execute it automatically. So, I decided to run an experiment, and this is part one. need to explain something. I genuinely believe that Fibonacci is better suited
[00:29] to manual trading than automated trading because when I look at the chart, there are certain moves that immediately stand out to me. I can see bearish structure. low. I can isolate the impulse responsible for the break. And then I
[00:42] can measure that specific move with the Fibonacci retracement tool. If price retraces deep enough, specifically the 61.8% level, that's an area that I'm interested in. If it continues, great. If it fails to make another low and the
[00:56] the market from the opposite direction. That sounds simple when I'm sitting in explaining what I'm seeing to a computer. A computer doesn't look at the chart and say, "Yeah, that move was completely obvious. I need rules, exact
[01:10] rules." So, that's where this experiment started. I took years worth of EuroUSD 5-minute data and started working with AI to mathematically define what I was seeing with my own eyes. And this turned into a much bigger experiment than the
[01:22] last one. The AI wrote hundreds of Python scripts. We tested thousands of historical structures. We changed the definition of the impulse like 600 times. We tested different Fibonacci retracements. We looked at consecutive
[01:35] bullish and bearish structures. We built a trading view strategy. Then we converted it into an MT5 expert advisor. And at several points during this experiment, the strategy just wasn't good. which is important because I
[01:47] keep changing parameters until eventually I find some back test that looks amazing. That's super easy to do. Giving the information a bias to give you the results that you want is way easy. If you test enough combinations,
[02:01] worked historically. And that doesn't mean that you've discovered an edge. It just means that you've perfectly measured the past so much so that it won't work in the future. So instead, I wanted AI to help me answer a different
[02:14] question. what separates the Fibonacci setups that worked from the ones that really interesting. One of the strongest differences it found was something I hadn't originally included in my strategy. It wasn't simply the size of
[02:27] the impulse. It was the size of the impulse relative to the volatility of the market at that moment. Basically, imagine EuroUSD has been moving relatively slowly. Then suddenly price makes a large structural move. That's
[02:39] different from the exact same size move happening when the market is already going crazy. So, we measured the impulse against the ATR. That's the average true range. And the data started suggesting that the Fibonacci setup following
[02:51] unusually large impulse moves were performing substantially better. Specifically, once the impulse was roughly five times the recent ATR, then this is where I had to be careful because whenever you find a number like
[03:06] because whenever you find a number like 4.9 or 5.1 or something ridiculously specific in terms of ATR, that's when you need to hold up a red flag and say, "Hold on a second. Maybe we just found a perfect historical number." So, instead
[03:18] of accepting it, the AI tested the surrounding values. And interestingly, the effect didn't disappear. It was a fairly broad range around roughly five fairly broad range around roughly five to six times ATR where the strategy
[03:31] continued to perform better. So, we froze it. Five times ATR. No optimization to find the best number. Just a simple rule. The impulse has to be at least five times the current 14 period average true range. Then I took
[03:44] that rule and put it back into the MT5 expert advisor. And this is where we finally got interesting results. Testing EuroUSD on the 5-minute chart from EuroUSD on the 5-minute chart from January 1st, 2020 through August 2026,
[03:57] the EA took 80 trades. 26 were winners, 54 were losers. So, the win rate was only 32.5%. Which sounds absolutely terrible until you look at the payoff. The average winning trade was about $28.88.
[04:11] The average losing trade was about $6.71. So, the average winner was four times larger than the average loser. Across the entire test, the strategy made $388
[04:24] using a fixed 0.1 lot size, and the profit factor was 2.0. 07. Meaning that for every dollar the strategy lost historically, it generated just over $2 in gross profit. Now, I immediately had another concern. What if the performance
[04:37] came from one specific crazy year, especially 2020 because of the pandemic? results, I broke the trades apart yearbyear. And this was probably the most interesting result from part one. 2020 was profitable, 2021 was
[04:50] 2020 was profitable, 2021 was profitable, 2022, 2023, 2024, 2025, and 2026 up until right now, the end of August, was profitable. Seven calendar years, seven profitable periods. All of them had a profit factor between 1.3 to
[05:07] them had a profit factor between 1.3 to 3.1, averaging out at 2.05. That's here and tell you that I've created some incredible profitable Fibonacci trading tool because there's a massive problem in this test. 80 trades, that's it. 80
[05:22] trades across more than six years. That's roughly one trade per month. And in some years, we're talking about incredibly small samples. 2024 only produced five trades. One winner could completely change those statistics. So,
[05:35] as interesting as it is to get a profit factor of 2.07, 07. I don't think 80 trades is remotely enough evidence to declare victory. And this brings me back to what I said at the beginning. I still believe the style of Fibonacci trading
[05:48] is definitely better suited to manual trading because my eyes recognize the context that I'm struggling to explain mathematically to a computer. I don't consciously calculate whether the impulse is exactly 4.9 times ATR when
[06:01] I'm trading. I look at the charts and I think that move matters. Something happened here. Price broke structure aggressively. Now, I'm interested in we're trying to do with this experiment is figure out what my brain is actually
[06:14] recognizing and then have the computer make that decision for me. I just don't know how to translate what I see into what a computer can quantify. So, I'm not finished. This is part one cuz this experiment took me many days. And not
[06:28] like, oh, I played around for 15 minutes. I mean like 10hour days. I'm literally hitting limits on my holy premium package of chat GPT. So, from break this strategy. I'm going to test nearby ATR requirements to make sure
[06:42] number, and I'm going to look at way more historical data, cuz more data is why the strategy worked extremely well in certain years and barely made anything in other years. And most importantly, I'm going to keep trying to
[06:57] opportunities without destroying the things that appear to be creating the edge in the first place. Because getting more trades is easy, but getting more trades that are good is difficult. And maybe, just maybe, this experiment
[07:11] eventually ends with me discovering that you simply can't automate the way that I completely possible because each Fibonacci move in my eyes is different. higher time frame, some are lower time frame. But honestly, that would still be
[07:26] a really interesting result because then the question becomes, what exactly can a struggling to teach a machine to see? And that's what I'm going to figure out in part two. If you guys enjoyed this video, share it with your friends. Thank
[07:38] you so much for watching and we'll see you in the next