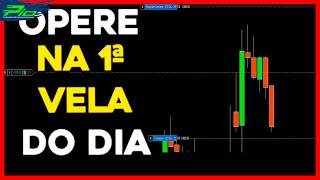

Simple Strategy: First Candle Signal
43sTeaches a quick, actionable trading method using only two moving averages, appealing to traders seeking efficiency.
▶ Play Clip"The title accurately promises a simple strategy using exponential moving averages at market open, and the video delivers exactly that."
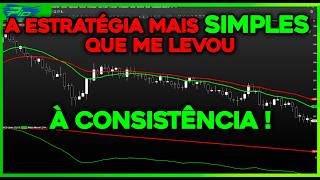
This video presents a simple day trading strategy for the Brazilian Mini Index (WIN) using two exponential moving averages (255 and 510 periods) on a 1-minute chart. The strategy relies on the first candle of the trading session to determine entry signals, allowing traders to set orders and step away from the screen.
The strategy uses two exponential moving averages: 255-period (lime green) and 510-period (red), both with D1 offset, on a 1-minute chart. These MAs indicate the primary market trend.
When the green MA is above the red MA, the primary trend is upward; when below, the trend is downward. The MAs act as support (green above red) or resistance (green below red).
In an upward trend, wait for the first candle of the day to close. The low of that candle must be between the two MAs or below the red MA. Place a buy order at that low with a 200-point target and a stop loss.
In a downward trend, wait for the first candle of the day to close. The high of that candle must be between the two MAs or above the red MA. Place a sell order at that high with a 200-point target and a stop loss.
If the first candle's low/high does not meet the criteria (e.g., low above both MAs in uptrend, high below both in downtrend), skip that trading session.
The presenter demonstrates the strategy on a rolling chart, showing a sell signal after the first candle's high is above the red MA. The order triggers and the trade is managed automatically.
This strategy allows traders to identify entry signals from the first candle of the day, reducing screen time. It is simple, rule-based, and can be automated with pending orders.
What are the two moving average periods used in this strategy?
255-period and 510-period exponential moving averages.
00:31
What type of moving averages are used?
Exponential moving averages (EMA).
00:45
What offset is applied to the moving averages?
D1 offset.
00:45
How is the primary trend determined?
If the green (255) MA is above the red (510) MA, trend is up; if below, trend is down.
01:12
What role do the moving averages play in an uptrend?
They act as support.
02:10
What role do the moving averages play in a downtrend?
They act as resistance.
02:24
What is the condition for a buy signal?
In an uptrend, the first candle's low must be between the two MAs or below the red MA.
03:33
What is the condition for a sell signal?
In a downtrend, the first candle's high must be between the two MAs or above the red MA.
05:18
What is the profit target for this strategy?
200 points.
04:13
What should you do if the first candle does not meet the entry condition?
Skip that trading session and wait for the next day.
06:12
Primary Trend Definition
Simplifies trend identification using two MAs, making it accessible for beginners.
01:12MAs as Support/Resistance
Explains how MAs dynamically act as support or resistance, a key concept for entry timing.
02:10First Candle Rule
Allows traders to set orders at market open and avoid constant monitoring, a practical time-saving technique.
03:06No-Trade Discipline
Emphasizes skipping sessions when conditions aren't met, reinforcing risk management.
06:12[00:02] strategy over the last few months, you'll notice that in December we had you can see, in January it wasn't so good, the strategy didn't do well in January, but in February and March the strategy did very well. It's an
[00:17] extremely simple strategy because right from the first Candy candle of the day, you'll know if you have an entry signal or not. Right from the first candle of the day, I'm going to ask you to put two moving averages on your chart.
[00:31] to put two moving averages on your chart. The first moving average will have 255 periods, and the second moving average will have 510 periods. We'll only use these two moving averages. Now let's configure these moving averages. They should be
[00:45] exponential, both moving averages with a D1 offset. The color of the 255-period moving average I'm going to put it in lime green. The 510-period moving average, exponential with a D1 offset. In appearance here, look, we'll put it in
[00:59] red. But why are we going to use these two moving averages with these configurations? It's very simple, I consider these two moving averages to be I consider these two moving averages to be 255 periods and 510 periods. 10 periods like the
[01:12] moving averages that show us the primary market trend, which is the strongest trend in the market. Okay, so if you arrive at the upwards, you will consider the primary market trend to be upward. If
[01:26] are crossed downwards, you will consider the primary market trend to be purely downward. It's that simple. And to teach you this extremely simple yet very efficient strategy, everything happens in exchange for
[01:39] you leaving a like, subscribing to this channel, and activating the notification bell so you're always notified of the various strategies I notified of the various strategies I 'll be bringing you in the future.
[01:56] Mini index timeframe, it's one minute, and here's the thing: observing these two moving averages, you 'll quickly notice the following: when the green average is above the red average and the price visits this region here, look at the
[02:10] moving average, we can see that the moving averages provide support. You can see that the price falls, feels the support region, rises again, falls, feels the support region, rises again, feels the support region, rises again. This is
[02:24] lot on the chart, and when the green average... It's below the red average, and the price visits this moving average region. The moving averages act as resistance. You can see that the price rises, feels the resistance region, falls again, rises, feels
[02:40] the resistance region, falls again, rises, feels the resistance region, falls again, rises, feels the resistance region, falls again. Look, it rose, felt the region, fell again. And I wanted to create a strategy, man, to use this to our advantage. I also wanted
[02:53] this strategy to be able to be operated by observing the first candle of the day so we don't have our faces glued to the screen, you understand, waiting for the entry signal. I'll explain to you now in detail how this works. Look,
[03:06] folks, the market opened here on this candle. Okay, and you can see candle. Okay, and you can see that the green average is above the red average, that is, the moving average region will act as support. In this case, you
[03:19] will then wait for the first candle of the day to close, and it is necessary, man, that you have the low of this first candle. Look, this is the low of the first candle. It is necessary that you have the low of the first candle between the
[03:33] have the low of the first candle between the averages, okay, or below the red average. So I'll repeat, you arrived in the market, saw that the trend was upward. So you know that you have to look for calculations, right? You know that the
[03:45] you'll wait for the first candle to close, and it's necessary that this first candle of the day has a low right here, between these two moving averages, or its low must be below the red moving average. That's what
[04:00] you need. In this case, you can see that the candle's low is below the red line. Okay, so in this case, yes, in this trading session you will have an entry. Great, that's the only information you need. As soon as
[04:13] this candle closes, you place your buy order at the low of this candle, which is at 200 points, and a 200- point gain, and wait for your order to be triggered. Okay, here you place your buy order. The price went up
[04:25] a little, then it fell, triggering your buy order, and then it went back up. This tends to work quite well because you are in favor of the primary trend and you are operating in a support region. Okay, so here
[04:39] you would have a positive target, because in this strategy the positive target is a gain and the loss limit is a Stop. In this case, since you had a gain, you exit the market and only return to trading on the next trading session. Now, on this
[04:52] other trading session... This is the trading session of March 21st... The first candle of the trading session on March 21st, this candle here, and you can see that the green average is below the red average, meaning you know the
[05:05] primary trend is downward. So you should look for sell signals next. So, you'll wait for this first candle of the trading session on March 21st to close, and when this candle closes, the high of this candle needs to be between
[05:18] the averages (okay) or above the red average. And in this case, as we can easily see, the high of this candle is above the red average. The high of this candle here is above the red average, so we do have
[05:32] then place our sell order at the high of this candle. So, look at the second candle of the trading session, our selected candle. Look, the price went up a little but then fell again, going in
[05:44] favor of the primary downward trend. And here we would also have a positive target this will happen in the previous trading session. Look at this trading session here from March 20th, the moving averages were crossed downwards, showing
[05:58] that the market direction is downward, that the primary trend is downward. It was necessary for the first candle of the day to have a high between these two averages, right? Or at least have its high above the red moving average. However, this didn't
[06:12] happen. The high of the first candle of the day is right here below the averages. In other words, we wouldn't trade on this session. As soon as this candle closed, we would close the market and return to trading on the next session. You understand? We would
[06:26] the first candle of the day, in the first minute, we would already know whether we should open trades or not. So, for example, on this day, February 16, 2023, the averages were pointing upwards,
[06:40] demonstrating a primary upward trend. We would need the low of the first candle of the day to be between the two averages or below the red moving average. But in this case, the low of the first candle was above the two moving averages,
[06:54] as you can see. So we wouldn't do anything, and it's a good thing we wouldn't, So we wouldn't trade here. We would close the chart and return on the next trading session, which in this case would be the trading session of the 17th of February. In February, on
[07:07] were still crossing upwards, demonstrating the primary upward trend. We had a candle that had its low below the red average, so yes, we could buy at the low of this Candy candle. I zoomed out a bit on the chart
[07:21] here; our selected order was right on the second candle. There wouldn't be a here below. Look, then this price would hit the exit here positive target would be hit on this dragon candle. In the following trading session, we wouldn't have signals, right,
[07:35] because the primary trend was downward. The first candle was below the averages. session; let's see the next trading session. Look, in this other trading session here, on were almost crossing the averages downwards, demonstrating the
[07:50] primary trend. The first candle of the trading session, this candle here, had its high between the two moving averages, which is what we're looking for, right? So we here. Look, at the high of this first candle of the day, our order would be triggered
[08:04] trade here below. So Okay, this is a simple way for you to trade right from the first candle of the day. You'll know right away, "Wow, there's an entry point or not," you understand? Right from the first candle, a straightforward way to
[08:17] complement the explanation, I'm going to show you this strategy with a rolling chart. Okay, gentlemen, the market just opened. This is the first candle; the wicks are heavily downward. So I'm going to position myself within the high of this candle. Okay,
[08:30] position myself within the high of this candle. Okay, you could see, the primary trend is downward, because the images are entry point. I'm following the strategy I taught you, okay,
[08:43] to do, man. My day is over, you understand? Sell positions there. Now I can go have a coffee, I can do whatever I want to do while my order hasn't been triggered. And it's already been triggered. Now it's just a matter of waiting, man. Now, literally, the
[08:57] work is over, man. Can you see that I've been trying to explore more and more different strategies here on this channel? I do this because people have different operational profiles, and I always want to
[09:10] At some point I'll be able to bring you a strategy that So if the strategy I brought you today didn't fit your
[09:22] maybe next week's will fit that profile. But you'll only know if you subscribe to this channel, if you leave your like, if you activate the notification bell. That way you'll always be up to date
[09:36] on all the objective strategies I'll be bringing here to the channel, okay? I won't stop until you become a successful, objective trader. I'll be signing off here, and until the next video.
⚡ Saved you 0h 10m reading this? Transcribe any YouTube video for free — no signup needed.