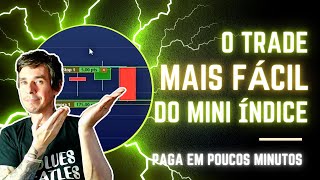

Easiest Trade for Beginners
45sPromises a simple, profitable trade strategy for absolute beginners, sparking curiosity and engagement.
▶ Play Clip"Title promises an easy entry for all, and the video delivers a straightforward, beginner-friendly strategy."
This video presents a simple day trading strategy for the Brazilian mini-index (WIN) that requires no knowledge of candlesticks, charts, or price action. The strategy is based on the market opening at 9 AM and the Ibovespa spot market opening at 10 AM, exploiting the tendency for the mini-index to reverse direction at 10 AM.
The presenter claims this is the easiest trade, suitable for absolute beginners with no knowledge of candlesticks or price action.
The mini-index opens at 9 AM (futures market), while the Ibovespa spot market opens at 10 AM. The mini-index is a derivative of the Ibovespa.
At 10 AM sharp, the market tends to go in the opposite direction from the previous candle. If the 9:55 candle is rising (green), sell; if falling (red), buy.
Use the 9:55 candle as trigger. Enter at 10 seconds before the 10 AM candle opens. Do not enter if the candle is a doji (small body).
Set a stop loss of 300 points and a profit target of 100 points. Take three gains of 100 points or adjust based on market amplitude.
Review previous days to check for losses. If there are many losses (knots), avoid trading. The strategy had 14 winning days out of 15 in one period.
Avoid trades if the candle is touching a thousand-point region (e.g., 109,000 or 108,000). This cancels the trade.
Risk management is more important than the technique. Use a stop loss of 300 points and move to breakeven after 75 points profit.
The strategy is simple: at 10 AM, trade in the opposite direction of the 9:55 candle. With proper risk management (300-point stop, 100-point target), it can be profitable. Backtesting shows high win rates.
What time does the mini-index futures market open?
9 AM.
01:13
What time does the Ibovespa spot market open?
10 AM.
01:13
What is the rule for trading at 10 AM based on the 9:55 candle?
If the 9:55 candle is green (rising), sell; if red (falling), buy.
03:14
When should you enter the trade relative to the 10 AM candle?
10 seconds before the 10 AM candle opens.
04:13
What is the recommended stop loss and profit target for this strategy?
Stop loss of 300 points, profit target of 100 points.
05:39
What should you do if the 9:55 candle is a doji (very small body)?
Do not enter the trade.
04:43
What is the 'thousand region' rule?
Avoid trades if the candle is touching a thousand-point region (e.g., 109,000 or 108,000).
09:03
How many winning days out of 15 did the strategy have in one backtest period?
14 winning days.
08:36
What is the nickname given to this trade and why?
Ronaldinho Gaúcho, because it looks one way and goes the opposite direction.
12:12
Easiest Trade for Beginners
Sets the expectation that no prior knowledge is needed, making it accessible.
00:02Opposite Direction Rule
Core of the strategy: trade against the 9:55 candle at 10 AM.
03:14Risk Management: 300 Stop, 100 Target
Simple risk-reward ratio that ensures profitability over time.
05:39High Win Rate Backtest
14 out of 15 days profitable demonstrates strategy effectiveness.
08:36Risk Management Over Technique
Emphasizes that discipline in risk management is more important than the strategy itself.
11:58[00:02] easiest trade I know, even if you're starting from absolute zero, know nothing about candlesticks, charts, or price action. Just put what I'm going to say in this video into practice, exactly as I'll explain, and
[00:17] you'll be able to put money in your pocket with this trade. So, want to know what this trade is? I bet you do! Come with me...
[00:32] Hello, welcome! I'm Viana, and it's a great pleasure to have you here on my channel. Go ahead and leave a like, subscribe to the channel, activate the bell, and follow me on Instagram for other tips and
[00:47] market openings every day and give other very valuable tips for you, so don't forget to follow me on Instagram. Okay, so what trade is this, Viana? I'm curious, I want to know how to do this
[00:59] trade that I don't need to know anything about price action, candlesticks, nothing at all! price action, candlesticks, nothing at all! Well, guys, every day the market opens at 9 am, and then we have the opening of the spot market at 10 am. For those of
[01:13] you who don't know, the mini-index is a... Ibovespa derivatives: The Ibovespa opens at 10 AM. So, if you go to the Ibovespa chart and set it to a five-minute chart, just click
[01:28] anywhere on the screen (5 here, enter) and it will go to the five- minute chart. You'll see this period break here, which indicates the period break. That is, this was yesterday, this is today, this is the day before yesterday, this is yesterday.
[01:45] basic chart. The Bovespa opens at 10 AM, while the mini-index opens at 9 AM. That's why we call it the futures market; it's like a
[01:57] betting house. So, Bovespa: "Ah, I think the Ibovespa will go up, so I come and bet. Ah, I think the Ibovespa will go down, so I come and sell the mini-index." The only thing I need to know is that at 10 AM the spot market will
[02:13] open. The Ibovespa represents approximately 80 companies. If you take the chart of these 80 companies, it will form a single chart, which is the chart of... Ibovespa. But you don't need to know any of this, I'm just telling you
[02:28] the basics of the strategy. I myself have several students who have already figured it out, who didn't even know that the Ibovespa was the spot market and the mini-index was the futures market, and that one was a derivative of the other. In other words, the mini-index only exists
[02:42] because the Ibovespa exists, and the Ibovespa represents real companies. But this is just for your information, so you know why I created this strategy. Well, if the market here opens at 9 am and it replicates the
[02:59] here opens at 9 am and it replicates the Ibovespa... Now, if it's the Ibovespa, it opens at 10 am, and I'm here at 9 am, I 'm trying to predict what will happen at 10 am, right? And then at 10 am, when the spot market opens, there
[03:14] 10 am, when the spot market opens, there will be volatility in the mini-index, and generally when the spot market opens at 10 am sharp, the market goes in the opposite direction from what it was going. So
[03:29] opposite direction from what it was going. So if the candle is rising before 10 am, 10 am sharp... I'm going to sell this. If the market is falling going to sell this. If the market is falling at 10 AM sharp, I'll buy. That's all,
[03:43] Viana. How do I know? On a five-minute chart, we have the candle countdown here. That is, it lasts five minutes, from 4:59 to 0. When it reaches zero, the next Kendall opens. So, what is the candle
[03:59] next Kendall opens. So, what is the candle before 10 AM? It's the Kendall at 9:55. before 10 AM? It's the Kendall at 9:55. A Kendall opens when it's approaching 10 AM, with 10 seconds left, or even three, two,
[04:13] one second. If you can't click after the 10 AM candle opens, okay? So you have this countdown here that helps you a lot. And what you're going to do is the 9:55 Kendall trigger, that is, the Kendall that will
[04:27] tell us whether to buy or sell. It's very simple: 9:55 Kendall. It does n't matter what its pattern is, if it's like this, if it's like this, n't matter what its pattern is, if it's like this, if it's like this, if it's like this, it does
[04:43] if it's like this, it does n't matter if it's positive at 10 seconds. From 10 seconds onwards, you can click. In a second, if you want, you can come here to this button, that guy, sell at market,
[04:56] that guy, sell at market, if it's falling, if it's falling, if it's like this folks? It just can't be like this, you know, the one with just one little line, you do
[05:11] n't know if it's positive or negative. So that's it, you don't enter. Except for all of these, you can enter if you can detect the color of the Kendall, simply go in the opposite direction. So if it's red like this, I'll
[05:25] buy by clicking here on the buy at market button. We call it aggressively entering the market when you accept the price as it is. And then you wait to And then you wait to get here without points, of course, you
[05:39] can get more points. Today I'll release the trading data from the day I got the most points. But you need to have more screen time. So you'll look for 100 points up here. I always tell you to make a Stop of
[05:53] 300 for a gain of 100, then take three gains of 100 and exit the market. Or you can, oh, I see that today the market is moving a lot, the amplitude, that is, the Kendalls are large, so I'll take... 300 points already on the
[06:07] first candle, right? In this trade, in this single trade, I can get 300 points, okay? But if you're starting out and don't know how to do it yet, take 100 points, that's great. Or you can do like me, you'll put this
[06:23] trade along with the others of the day. We have the first candle of the day, we simply trade candlesticks that have more body than wick, but that 10 am trade. What I'm going to teach you here is a trade that
[06:39] you practically don't need to know anything about, in fact, right? If you tell this to a child, they'll understand: " Oh, if it's red, you come to this button here and buy; if it's green, you come to this button here and
[06:54] sell." That's all. So you can add "How do I do it here?" add "How do I do it here?" along with the other three that I'm going to do during the day. To optimize this strategy, the only thing you can
[07:06] do is simply go back to the previous days. You take your mouse here, right? Scroll bar, you have to have this skill, folks. It's very simple, right? Your hand won't fall off if you do this. You look here, see who
[07:22] sold the green one, made a profit, come back another day.
[07:34] almost 200 points, 9:55 AM here, a loss, 9:55 AM, it was red,
[07:46] a loss, 9:55 AM, it was red, I bought, didn't lose, paid, 9:55 AM, I bought, didn't lose, paid, 9:55 AM, sold, didn't take the loss and paid. You 're seeing that on most days it pays, right? So far, only one knot, 10 AM, it was
[07:59] red, bought, paid. There have been better times, folks, we're in a normal period for this strategy, I'd say, so here it is, 9:55 AM, red,
[08:11] here it is, 9:55 AM, red, paid. So that's all, folks, look at the previous days and take a look to see what's happening. If there are knots, don't enter, that's all, that's the only prerequisite. Look at the
[08:24] last few days, wow, there are three or four knots, there's more Gloss than anyone else, so you don't enter, just that, just look at the previous days. There was a time here, right, when it
[08:36] look at the previous days. There was a time here, right, when it was 20 days, actually 14 days, only one was 20 days, actually 14 days, only one day of loss. Look, a strategy that delivers that, right? And the funny thing is that... We study a lot to discover
[08:48] that this strategy here has a higher acceptance rate than the others, right? Go figure, the simple really works, folks! So without further ado, let's see what happened today in the day's operations. Let's go to the video. Well, here,
[09:03] simply before 10 AM, I'm not going to do this trade here will I go in the direction it's going. So if it's going up there, I 'll buy. I didn't enter the first one of the day because it broke a
[09:16] thousand. What is a thousand? Every time it reaches the region that ends with 000, that reaches the region that ends with 000, that is, there it is at 109,000, 108,000, 107,000. So if the red candle here simply crossed a thousand, then I'm not going to enter
[09:29] short in the same direction. Okay, and now this little green one here, if it's going up, I'll click to buy. It went up, closed in the upper channel. This one isn't the trade I taught, okay? This one isn't the Kendall at 10 AM, it's
[09:44] only at 10 AM that I'm going against the previous Kendall, taking it away. At 10 AM I do the opposite: if it's green I 'll buy, if it's red I'll sell, okay? It needs to have more than 170 points and needs to have more body than
[09:59] wick, okay? I teach this in almost all the videos on the channel. Here I'm going to take 100 points here, I think I can get a little bit closer to the thousand, huh? I'll drag it a little,
[10:17] 125 points, it's at the thousand here, and you can see that a Stop of 300 points, right? If it hits the Stop I exit. If it gives me a win of 125 and hits a Stop of 300, I exit too. I always exit at the
[10:31] first Stop, so your winning day will always be 300 points and your losing day a maximum of 300 points, remember that. I move 75 points, I bring the stop loss to the entry point, now I do n't lose anymore, that is, this strategy makes
[10:47] n't lose anymore, that is, this strategy makes your Stop loss much more difficult, your loss. For those who don't know, loss is loss and gain is gain, here we usually call nobody and we're on that
[11:02] worst blow that was, so today I don't lose anymore. 300 points, you see the difference of having good risk management, guys, this works. You get 300
[11:14] risk management, guys, this works. You get 300 points in profit every day, today I'm not going to lose 300 points, look how beautiful that is! So sometimes I lose two days and it doesn't give back any day's profit, right? You went there, got two or three right, put
[11:28] 200 points in your pocket, then the third trade gives you a 300-point stop loss, you'll two days like that, you won't give back even one day's profit. Two days of loss will give you 200 points, a single day of profit will give you 300. That's how the account balances
[11:44] get a lot of feedback in the comments, feel free to read them, many, many, many thousands of students are already living this reality, students are already living this reality, which is correct management.
[11:58] Risk management is more important than the technique itself. The technique very simple, but respecting risk management is the most difficult activity in a trader's life. Put that in your head, get that vision and you'll go
[12:12] far, it's coming, our dear... We call this trade Ronaldinho Gaúcho because he looks one way and passes the other, so it's not a case of him going up and us going down at 10
[12:25] AM. Is there room to reach the 175 room to reach the 175 points that are missing? I sold 175 points here.
[12:48] market always looks for highs and lows, and the 50% region, no, no, it doesn't go back to my breakout, please, just come, just come, just come,
[13:05] Ronaldinho, come, come, come, Ronaldinho isn't having any difficulty, huh? He did n't send anything up, huh? n't send anything up, huh? Beautiful, huh? I didn't even get
[13:17] nervous here. Come on Ronaldinho, go for it, it's a goal, it's a great goal, guys, in Rondon, tick up, tell me if this isn't too good, this
[13:30] tell me if this isn't too good, this strategy, guys, it's very simple. The other thing is, if it were touching a thousand-point region, I forgot to say, this also avoids any trade that is touching the thousand-point region, that is, if it
[13:43] is touching the thousand-point region, that is, if it were touching 109 or 108, stay out of this trade. The thousand sign cancels out any trade; generally, with the thousand sign, we trade against it, but that's a topic for another video. So, simply put,
[13:57] if the candle is green, you sell; if it's red, you buy. Ronaldinho Gaúcho looked one way, passed the other – amazing goal! If I helped you in any way, don't forget to check your subscription and leave a
[14:09] check your subscription and leave a like too. Until the next video!
⚡ Saved you 0h 14m reading this? Transcribe any YouTube video for free — no signup needed.