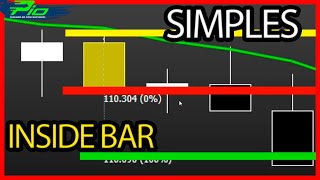

How to Enter and Exit Trades with Fibonacci
60sClear, step-by-step entry and target setup with Fibonacci projection appeals to traders wanting practical execution.
▶ Play Clip"Title accurately promises a simple and effective inside bar strategy; video delivers exactly that."
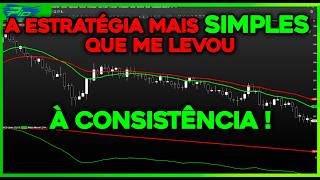
This video presents a simple and effective day trading strategy for the mini-index on a 5-minute timeframe, using two exponential moving averages (9 and 34 periods) to determine trend direction and inside bars as entry signals. The strategy aims to simplify trading by focusing on clear trend alignment and breakout entries, with Fibonacci projections for profit targets.
Set two exponential moving averages: 9-period (lime green) and 34-period (red), both with offset D1. These indicate trend direction: cross up = uptrend, cross down = downtrend.
Use the 'Inside Candle' indicator (Insert Color Rule) to highlight inside bars in yellow. An inside bar is completely covered by the previous candle's high and low.
Trade only until 1 PM. Positive target is one gain per day; daily loss limit is one stop loss. If stopped out, stop trading for the day.
For a buy: place a buy order at the high of the inside bar, stop loss at the low, target at 100% Fibonacci projection (from low to high of inside bar). For a sell: sell at the low, stop at the high, target at 100% Fibonacci.
If a new inside bar appears before the previous order is triggered, cancel the old order and place a new one at the new inside bar's high/low.
If moving averages cross, cancel existing orders and switch to the new trend direction. For example, if averages cross down, cancel buy orders and look for sell signals.
When a sell order is triggered, immediately place a stop at the inside bar's high. The target is hit when price reaches the 100% Fibonacci level.
The strategy is simple: follow moving average cross for trend, use inside bar breakout for entry, and set target at 100% Fibonacci projection. Works on 5-minute mini-index.
This inside bar strategy, combined with moving averages and Fibonacci targets, offers a straightforward and efficient approach to day trading the mini-index. By adhering to strict risk management (one gain or one loss per day), traders can maintain discipline and simplicity.
What are the two moving average periods used in this strategy?
9-period and 34-period exponential moving averages.
00:34
What offset is applied to the moving averages?
Offset D1.
00:34
How is an inside bar defined?
A candle that is completely covered by the previous candle's high and low.
01:42
What is the daily trading time limit for this strategy?
Trade only until 1 PM.
02:28
What is the daily gain target and loss limit?
One gain target per day and one stop loss limit per day.
02:28
For a buy trade, where is the stop loss placed?
At the low of the inside bar.
03:50
What Fibonacci level is used for the profit target?
100% Fibonacci projection.
03:22
How do you draw the Fibonacci projection for a buy trade?
Click on the low of the inside bar and drag to the high of the inside bar.
03:22
What should you do if a new inside bar appears before the previous order is triggered?
Cancel the old order and place a new one at the new inside bar's high/low.
05:36
What action is taken if the moving averages cross during an active order?
Cancel existing orders and switch to the new trend direction.
06:53
Simple Moving Average Setup
Establishes a clear, objective trend-following foundation using only two exponential moving averages.
00:34Inside Bar as Entry Signal
Uses a classic price action pattern for entry, making the strategy accessible to beginners.
01:27Strict Risk Management
Limits daily trading to one gain or one loss, enforcing discipline and preventing overtrading.
02:28Fibonacci Projection for Target
Provides a fixed, mechanical profit target, removing subjectivity from exit decisions.
03:22Adapting to Trend Reversals
Demonstrates how to dynamically adjust to changing market conditions by canceling orders and switching direction.
06:53[00:02] bother you a lot when you're opening positions in day trading. And I solved those three problems to help you with day trading. And these three inconveniences were resolved in a completely clear, simple, and objective way. And I talk more about
[00:19] that in the first link in this video's description. Just click and you'll understand how I solved these three problems. Hey, in today's strategy, we're going to use the mini-in on the 5-minute timeframe. And
[00:34] you need to set up two moving averages, one moving average with nine periods. Next, you set a 34-period moving average. Double-click on the nine-period moving average, change it to exponential, and set the offset to D1. And
[00:48] you can choose whatever color you want. I'm going to use the color lime green. Now I click on the 34-period moving average and change it to exponential. I set the offset to D1 and set the color to red. OK? These two moving averages will give us
[01:02] the direction of the market. If the moving averages cross downwards, that is, if the nine-period moving average crosses downwards from the 34-period moving average, I will believe in a downward movement , in a downtrend. Now, if
[01:15] the metrics are crossed upwards, I will be considering an upward trend, an upward movement. Beauty? So, what will be our entry point? Our entry point will be the inside bar. Simply
[01:27] right-click on the chart, then select " Insert Color Rule," search for " Inside Candle," and click "Insert." Ready. Now, all the yellow candles that appear to you, like you have here, look, a yellow candle right here,
[01:42] look. So, every yellow candle you find on the chart is an inside bar. The inside bar is that candle, dude, that is completely covered by the previous candle. So, for example, here we have a candle, and the previous candle
[01:56] completely covered this candle here, right? So, the previous candle covered both the high and the low of that candle. So, this candle here becomes an inside bar, and we can use this as an entry point. I'm going to teach
[02:08] you this strategy today. I have several other strategies for teaching. And all I ask in return is that you subscribe to this channel, leave a like, and comment on what you think of this strategy, okay?
[02:28] trades until 1 PM at the latest. And my only positive goal in this strategy is a gain. And my daily loss limit in this strategy is just trading. And if I get a stop loss, I
[02:41] explain this strategy. Dude, a day trading strategy doesn't have to be complicated. I'm going to show you this now. Look, this is the are crossed upwards, meaning the nine-period moving average is crossed
[02:55] above the 34-period moving average. So you already know that you have to look for things to buy, OK? All you need now is an entry signal, an entry point, in other words, you need an inside bar. An inside bar is opening, OK?
[03:08] You will wait for the candle to close, and if the candle closes in the yellow color, you have an inside bar. When you find a bar test, you simply place your So, the green line signifies a buy transaction. And now you can
[03:22] use in this strategy is as follows: you click on the low of the candle and drag it to the high of the candle. And your target would be here, look, at 100% of the Fibonacci projection. Beauty? So you already have your entry point and
[03:36] you already have your target. Your order has not yet been executed. This candle crosses the green horizontal line that represents our buy order. As soon as our buy order is triggered, we take
[03:50] our stop order and place it at the low of the inside bar. So, look, we have our buy order here at the high of the inside bar, our stop order at the low of the inside bar, and we have our target here at the 100% Fibonacci retracement,
[04:04] Zooming out here, it's possible to see that the averages are still aligned upwards, still crossing upwards, demonstrating an price would catch our exit. We would already have a positive goal here. Of course, it's up to
[04:18] you to decide how many mini- contracts you're going to enter into. You can see the size the target would be here, for example. For example, the target, man, here is around 195 points. So, knowing this, you have to calculate
[04:32] how many mini-contracts you would enter with. I'm going to show you a sales transaction now, and I'll take this opportunity to share some observations, okay? Here are some situations that can occur while you are operating. Let's
[04:44] attention to the right side of the graph. This is the first candle of the trading session, OK? The averages are still aligned downwards, they are still crossed downwards. So, initially you would be looking for sales, OK? Now that the most popular prices
[04:59] have crossed upwards, you can start looking for purchases. The inside If the candle closes in yellow, you know it's an inside bar. If this happens, you can place a buy order at the high of
[05:11] that inside bar. Then we take the Fibonacci projection, we click on the low of the candle and drag it to the high of the candle. So the exit from the operation would be here at the 100% level. And then we wait for that order to be
[05:24] we wait for that order to be triggered, that buy order. a new buy entry signal appeared . So, since a new buy signal has appeared
[05:36] hadn't been triggered, what should we do? We cancelled that purchase order, right? We can cancel out our target here as well. We place a new buy order at the high of this new bar, since the
[05:49] averages are aligned upwards. And again we draw a target, click on the low of the candle, and drag to the high of the candle. We can set the exit of the operation here at the 100% level, look. And then again we're left
[06:01] waiting for that purchase order to be triggered. The same situation happened down here. You can see that a new inside bar has appeared, a new buy order was triggered up here. It wasn't activated up here.
[06:13] So, once again, we cancel these orders here and place them at the maximum of this new inside bar. We placed a buy order at the high of the sidebar, redrew the target, and placed our exit at the 100% level here. So,
[06:26] we have our buy order here and our target for the operation right up here. We just have to wait now for our order to be activated. Once again, a new buy signal appeared before the previous buy signal had been triggered.
[06:38] We erase it again and repeat that process in this new inside bar. Buy order at the high, target at the 100% Fibonacci projection. and here would be our exit from the trade, our target. But look what happened
[06:53] next, man. The averages have crossed downwards, meaning we no longer have an upward trend. We must cancel our orders again, and now we must look for sales. Since most of them are crossed downwards, we
[07:06] need a boat test. Now we have a bar chart with the moving averages crossing downwards. So we should place a sell order and position it at the low of that bar, right? You wait for that side bar to close, then
[07:19] low of that inside bar. Next, you take the Fibonacci projection and draw the target here, right? Our exit from the trade is at the 100% Fibonacci level right down here. So I'm going to highlight our exit from the operation in green. And as soon as
[07:34] our order is triggered, as soon as the candle crosses our sell order here, which in this case is represented by this red line, you quickly grab a stop order and position it at the high of the candle. Beauty?
[07:46] look, this candle here, as soon as it appeared and triggered our sell order, quickly set a stop order, place it at the high of this inside bar, and then your exit point. Can you see that this candle here, the same candle that
[08:01] triggered your sell order, was the candle that triggered your exit down here? So you had a positive goal. I wanted to show you this auction, like I things have been changing, right? Many things have changed. First you
[08:13] thought you were going to have a purchase operation, right? Look at these spots here. candles here, we thought we would be making buy trades, but in the end, we closed with a sell trade right
[08:26] that I show you, okay? Because these kinds of trading sessions, like this one, will operating, okay? But in general, this is a very simple strategy. June, okay? Look, this was the first sign we had in this
[08:42] upwards, right? We had an inside bar right here, the price would hit you at the exit up here , look, at the 100% level, okay? This would trigger our purchase order, which I will now highlight in green. Look, our stop loss would be down here, at the
[08:55] low of the inside bar, and our target would be up here, right? So it would be on the next trading day. In that other trading session, we had our first signal right here. This boat rehearsal. As you can see, our target would be
[09:08] down here. Our order would have been activated where I've highlighted in red. Look, our exit would be down here in green and our stop would be up here, right? And what did the price do? The price went up and would have stopped us out up here
[09:21] . So, in this auction, the limit for area loss would have been reached. It would be a stop. that trading day and only resume trading on the next trading day. In this new trading session, the signal that was triggered was right here, okay? Then we would have the inside
[09:35] bar with the averages aligned downwards. We would sell at the low of this inside We would sell at the low of this inside bar, where I've put the red color, stop at the high of the inside bar, target at the 100% level here, look. So it would press
[09:48] our sell order right up here, look, it would grab us down here, look. So, we would have a positive target in this trading session. Let's see what the next trading session will be like. New as the averages are aligned downwards. We had a bar rehearsal here
[10:01] triggered right here. Our target for the operation here is 100%, look. Our stop bar rehearsal. Our sell order would have been triggered right here, and the price would have gone
[10:13] down here. Look, that wouldn't be a positive target in this trading session. Let's see what the have the moving averages crossing downwards. We had an inside bar here. Then the sell signal. We would sell at the lowest price of that inside bar. Our exit
[10:26] would be at the 100% level and our stop would be at the high of the bar test. And the price would trigger our sell order right here, but it wouldn't catch our exit. In reality, it would go up and catch our stop right up here. So, the
[10:41] daily loss limit was reached in this trading session. Stop. We would stop operating and only resume operations on the next trading day. So, look, in the next few trading sessions we had this signal here, okay? Buy signal. Since we were further
[10:55] up, we had the inside bar right here. The entry would be here, the stop would be at the low of the inside bar, and the target would be at 100%, right up here. That would stop trading on that trading day and move on to the next one. So now one
[11:10] crossed downwards, right? The trend was downward, and we had an inside bar, which is a sell signal. So we would sell at the lowest point of that inside bar, which I've highlighted in red. Our stop loss would be at the high of this inside bar, and our
[11:24] target would be at the 100% level. Our sell order would be triggered right here at this point, look, the price would hit down here. So we would have also hit our positive target in this trading session. So, generally speaking, it's a
[11:37] efficient as well, right? All you need to do is observe whether you have averages downwards. If they have crossed up, you'll be looking for purchases. If you have downward-pointing crosses, you'll be looking for sales. And its entry point is an
[11:51] with the higher highs pointing upwards, like you have right here, you buy on the breakout of the high of that inside bar. trends have crossed downwards, you sell on the breakout of the low
[12:06] of the inside bar. Simple as that. It's a simple and efficient strategy for the 5-minute timeframe on the mini-index. Hey everyone, the market just opened and we can see that the averages are aligned downwards, right?
[12:18] So, if we have an inside bar with the moving averages crossing downwards, I'm going to look to sell at the low of that inside bar. Beauty? There are 30 seconds left until bar. Beauty? There are 30 seconds left until this candle closes, and it looks like
[12:31] it's going to close like a rehearsal bar. Beauty? So let's wait for this candle to close. 20 seconds left. Now [Music],
[12:43] you saw here that I measured, right, the score that this bar rehearsal has so I could figure out how many mini-contracts I would get. So I'm going to put in 18 mini in line with what I want to risk, obviously. Now I'm going to reveal
[12:56] the target of the operation. The goal here is 100%, okay, everyone? I'm placing a sell order because the moving averages, as you can see here, are aligned downwards, crossed downwards. If my sell order is
[13:08] triggered, I'll place my stop order up here, at the high of this That's it, folks. The sell order was triggered in favor of the averages here. Beauty? My work has already been done today .
[13:21] . [Music]
[13:35] I'm going to stay here, man, and see you in the next video. Dude, these three things probably bother you a lot when you're opening positions in day trading. I solved these three problems to help you with day trading. And these three
[13:50] inconveniences were resolved in a completely clear, simple, and objective way. I talk more about this in the first link in the description of this video. of B.
⚡ Saved you 0h 14m reading this? Transcribe any YouTube video for free — no signup needed.