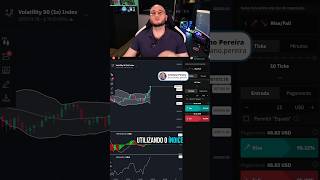

Profitable 5-Tick Trade on Volatility 50
37sShows a quick, successful trade with real profit, appealing to aspiring traders.
▶ Play Clip"The title promises real-time day trading and delivers exactly that — but the content is thin, with repetitive entries and no educational depth beyond basic indicator signals."
This video is a real-time day trading session on the Derive broker, focused on the Volatility 50 (1-second) index. The trader executes rapid, short-term trades based on technical indicators, aiming to profit from price corrections after strong upward movements. The session concludes with a net profit of $51.23 (approximately R$289.05).
The trader opens the session on Derive using the Volatility 50 index with 1-second candles. The plan is to make at least 5 quick trades to keep the video short. The strategy targets devaluation (put) entries when the asset breaks above the upper Bollinger Band, expecting a reversion.
The asset is in a strong uptrend and breaking the upper Bollinger Band. The trader enters a 5-tick put, expecting the price to revert to the band. MACD is far from the signal line and volume is high. The first trade is a win of $9.53.
The price remains outside the upper Bollinger Band. The trader places a 10-tick put on devaluation. This trade results in a loss of $10, which is deducted from the running total.
After the loss, the trader applies a Gale of $25, again betting on devaluation. The asset corrects slightly but the trade is lost, resulting in a -$25. The trader acknowledges the need to be more cautious on the next entry.
RSI reaches 75, indicating overbought conditions. Volume is rising. The trader takes another devaluation entry, expecting a correction. This trade wins $57.17, bringing the running profit to $32.
The trader returns to 5-tick entries with $10 stakes. Another win of $9.53 brings the total to $41. A final entry also wins $9.53, closing the session with a total profit of $51.23.
The session ends with $51.23 profit, converted to R$289.05 at the current dollar rate. The trader invites viewers to follow for more real-time day trading videos.
The video demonstrates a practical, indicator-driven day trading approach on the Volatility 50 index, combining Bollinger Band reversion, RSI overbought signals, and a Gale recovery strategy. Despite two losses, disciplined trade sizing and a strong winning trade yielded a net profit of $51.23 in a short session.
Which broker and index are used in this trading session?
Derive broker, using the Volatility 50 index with 1-second candles.
What is the core strategy when price breaks above the upper Bollinger Band?
Enter a put (devaluation) trade expecting the price to revert back to the Bollinger Band.
00:12
What is a 'Gale' in this trading context?
A martingale-style recovery bet — increasing the stake (here to $25) after a loss to recover it.
00:50
What RSI level signals overbought conditions in this session?
RSI reaching 75, which the trader uses as a signal to enter a devaluation trade.
01:25
What was the final net profit of the session and its conversion to Brazilian reais?
$51.23, converted to R$289.05 at the day's dollar rate.
02:27
Bollinger Band Reversion Strategy
Demonstrates a concrete, repeatable entry rule: betting on reversion when price breaks the upper band with strong momentum indicators.
00:12Gale Risk Management
Shows a real martingale recovery attempt, illustrating both the appeal and the risk of doubling down after losses.
00:50RSI Overbought as Entry Trigger
Uses RSI at 75 as a quantifiable overbought signal that justifies a counter-trend entry.
01:25Net Profit of $51.23
Provides a concrete, measurable outcome of the strategy over a short session, including currency conversion.
02:27[00:00] Vamos lá então traders, fazer algumas operações aqui na corretora Derive, utilizando o índice de volatilidade 50 de um segundo. Vou fazer entradas rápidas para que o vídeo não fique tão longo e eu consiga fazer pelo menos umas 5 operações, ok?
[00:12] Estamos aqui, o momento do ativo é de alta forte, está rompendo a banda de Bollinger superior. Uma hora ou outra esse ativo vai retomar a banda de Bollinger. Eu vou fazer entradas de 5 ticks na desvalorização.
[00:25] Vocês podem ver também que o MACD está bem distante ali da minha linha Sinal, um volume bastante alto. A primeira entrada eu consegui pegar uma win. Aqui vocês podem ver o valor, 9,53. Colocar aqui na minha calculadora.
[00:37] Vamos continuar aqui. Continua fora da banda de Bollinger superior. Vou fazer agora uma entradinha com 10 ticks. Continuando, fazendo aí na desvalorização. Que o ativo vai retomar, vai pegar uma correção
[00:50] e novamente vai ficar abaixo da banda de Bollinger. Tomei um loss agora. Tiro da minha calculadora aqui 10 dólares. Faço agora um Gale de 25. 25 novamente apostando na desvalorização vamos acompanhar aí
[01:04] o ativo pegou um pouco a correção tá trabalhando ali praticamente um doge tomei um nós novamente aqui menos 25 eu acredito na desvalorização só que agora a minha terceira entrada o meu segundo game eu tenho que ser mais prudente t ent vamos aguardar ali vamos ver a movimenta pra fazer cinco ticks de contrato Pode ver o volume ficando cada vez mais alto
[01:25] Meu RSI, 75 já. Tá já acima da minha sobrecompra. Tá vendo? Tá subindo bastante. Vou aproveitar que ele subiu tudo isso, vou pegar mais uma entrada na desvalorização. Esse ativo
[01:37] tem que corrigir, tá? Vamos esperar aqui, ó. 9, 8 vai corrigir. Beleza, peguei uma win de quanto? 57,17 dólares. 57,17.
[01:49] Beleza. Estou com 32 dólares no positivo até o momento. Vamos pegar aí mais algumas entradas. 5 ticks agora. Volto para 10 dólares para a minha primeira entrada. Continua fora da banda de Bollinger.
[02:01] Eu ainda vou fazer entradas na desvalorização. Aí, ó. Entradinha. Beleza. Mais uma win. 9,53. São 41 dólares. Só mais uma entrada para fechar com 50 dólares.
[02:14] Vai, vamos lá. Aí, mercado indo a meu favor, beleza. Consegui terminar mais uma entrada com gain, mais 9,53. Finalizo as operações em pouco tempo com 51,23 dólares.
[02:27] Que aí, vezes 5, vamos ver. Dólar hoje, 51,23, 289,05 reais. Segue aí o Cristiano Ponto Pereira para mais vídeos como esse, fazendo day trading em tempo real.




⚡ Saved you 0h 02m reading this? Transcribe any YouTube video for free — no signup needed.