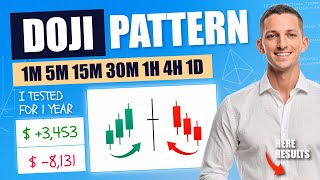

Testing a Viral Doji Candle Strategy
45sViewers are curious if popular trading strategies actually work, and this clip sets up the test with a clear explanation.
▶ Play Clip"The title promises a test of a strategy, and the video delivers exactly that, with a clear and honest breakdown of the results."
This video tests a popular Doji Candle trading strategy across multiple markets and timeframes. The strategy aims to predict trend reversals by identifying Doji candles and confirming with subsequent candles. The backtest results show that the strategy mostly loses money, primarily due to commissions.
The strategy involves identifying a trend, waiting for a Doji candle, and then confirming the reversal with two more candles before entering a trade.
The backtest uses configuration files for the freqtrade package, including a list of 100 liquid crypto tickers and similar files for stocks, futures, and forex.
The strategy uses MA-based exit conditions and a custom stop loss. Hyperparameters are tuned during optimization.
In the crypto market, the best result was $873 profit on the 1-hour timeframe, but most other timeframes lost money.
The US stocks market best result was only $21 profit, and the futures market best was $22. The forex market best was just $1.3.
The final results table shows that the strategy loses money in most markets and timeframes. The main reason is commissions, which eat away any potential profit.
Mostly Losing Money
The final results table shows that the strategy loses money in most markets and timeframes, which is a crucial reality check for any trading strategy.
10:11Commissions are the Main Culprit
The strategy often predicts reversals correctly, but commissions eat away any potential profit, highlighting the importance of considering trading costs.
10:37Best Result in Crypto
The only significant profit was $873 in the crypto market on the 1-hour timeframe, showing that market selection is critical.
09:15Strategy Needs Improvement
The conclusion is that the strategy needs improvement to be profitable, which is a valuable lesson for traders testing influencer strategies.
11:08[00:00] Hi everybody, it's Trading News Busters and today once again we are testing a trading strategy by a popular influencer and today we are testing a Doji Candle strategy. Now, what is this strategy about? So, basically we want to have some trend and we can say that we kind of can predict when it reverses.
[00:19] So, for example, here we have a downtrend, then we see a Doji Candle. Doji Candle is a candle with a thin small body and small wick. For example, here we have a downtrend and we are waiting for a green Doji candle.
[00:31] And then we kind of expect this trend to reverse. But to be more sure about this, we wait for two more candles and if they're also green, we enter a long trade expecting price to go up.
[00:43] And the opposite is done for an uptrend. And here is the final results table. You can pause and check it now and we'll discuss it in the end of the video. Now let's check our code starting with some config file.
[00:55] First is config.json. It's a basic configuration file for free trade Python package. Next, backtest.json. It's a file that specifies some parameters for our trading logic.
[01:07] Next, crypto.json. Here we have a list of 100 most liquid tickers that we are using. Next, us-stocks. Similar file, but for stocks markets and futures and forex. Now let's check the main script.
[01:20] Here is our main class, strategy and comments. Some parameters for our Python package. And here we have our hyperparameters. You can see if they all have default values and we'll later
[01:32] tune them during hyperparameter optimization. A function to determine if a candle is a doji candle. And our entry rating, so just our entry conditions. And exit conditions we use MA-based
[01:45] exit conditions as we often do. And the custom stop loss. Now let's check visualization of our trading process. So, here you can see our plot, price chart, volume and exponential moving average.
[01:59] It's used for trade exits. So, for example, our first trade, you can see we had a over the downtrend here and then we had a green doji candle. That's what we expected. Then we had two more candles to
[02:13] confirm it and only then we entered. So, here you can see our stop loss level and just as we expected price reversed and we have some huge profits here. Another example so here you can see
[02:25] price changing direction rapidly but here you can see we had an uptrend then we had a dodgy candle here and you can see here is our soco so we expect price to go down price actually goes down as we
[02:38] expected and then we exit using our moving average when moving average crosses our price Here is one one more example of a successful trade So here we have an obvious downtrend And then I will zoom in Here we have a red doji candle that we affected So we enter
[02:57] a long trade. Here is our stop loss by the way. And our price actually changes direction. So here with an average closest price and we get our profit. And here is an example of not so successful trades, so here we actually lost, once again we are having a downtrend,
[03:14] and then we see a clear doji candle, green doji candle, we set our stop loss, then we wait for two more candles to confirm trend reversal, so actually we can see one, two, we confirm, we enter a long trade, but then price continues to go down, and our stop loss
[03:30] hits, and you can see here if our stop loss was lower, maybe we could have made some profit, our support is here and we lost on this trade and another example of an unsuccessful trade so here
[03:42] you can see we're having an uptrend and then we see a huge doji candle so you can see it has a low small body and huge weeks and we wait for two more candles to confirm changes also here is our
[03:55] stop loss and we enter short trade but then trend actually continues and hits our support so we lose money here. Now let's get to the results. Starting with crypto market one day time frame. You can see the command that I run here on the top of the screen. Then we have logs and here base 10 was
[04:13] performing ticker, some stats and metrics and we are interested in sharp ratio. Here it's negative minus 0.27 and our total profit is minus 221 dollars. Next for our time frame our table with
[04:28] and once again negative sharp minus 0.24 and we lost $100. Next one hour time frame. Sharp is once again negative minus 1.05 and we lost $140. 30 minutes time frame.
[04:45] And sharp is even lower, it's minus 15 this time and we lost more than $1000. $1,000. 10 minutes time frame. Once again, vegetable shop, minus 12, and it lost $880.
[05:00] 5 minutes time frame. Table with results. Shop with minus 99, and it lost $2,500. 3 minutes.
[05:12] Once again, table with ticket results, and shop with minus 272, and it lost more than dollars once again and final time frame for crypto market one minute well still negative sharp minus
[05:28] two thousand and we lost more than two thousand dollars now let move to stocks markets once again starting with one day time frame Our locks Table with best and worst pairs And our main metric sharp is minus 0 and we lost Two hours time frame Once again negative sharp minus 0 and we lost only just One hour time frame
[05:57] Finally, a positive Sharpe 1.1 and our profit is 110$. 30 minutes time frame. Results per player.
[06:11] Negative Sharpe minus 0.67. We lost 43$. 15 minutes time frame. Well, Sharpe is negative once again minus 1.01 and we lost 33$.
[06:23] 5 minutes time frame. Sharpe is negative, minus 5.66 and we lost just $40. And finally, 1 minute time frame, the stock market.
[06:36] Sharpe is minus 200, this time very low, and we lost $140. Now we are moving to futures market. Once again starting with 1 day time frame. You can see the command here on the top.
[06:50] Starting with a positive sharp, 0.11, and our profit is only $30. Next 4 hours. Once again positive sharp, 0.14, and our profit is just $14.
[07:04] Next 1 hour time frame. This time sharp was negative, minus $2.68, and we lost $200. 30 minutes time frame. And once again positive sharp, impressive, 0.57, and our profit is $32.
[07:19] 15 minutes our table with pairs and sharp is negative minus 1.83 and we lost only just $80 5 minutes time frame and this time sharp is negative minus 2.3 and we lost $41 3 minutes
[07:38] time frame and sharp is minus 5 and we lost $36 final time frame for this market 1 minute and sharp is minus 37 very low and we lost 264 dollars. Final market Forex once again
[07:58] starting with one day time frame our results were fair and we are starting with a negative sharp minus 0.19 and we lost only just 16 dollars not much. Next 4 hours time frame result table
[08:14] and negative sharp minus 1 and we lost 31 dollars 1 hour 10 frames This time we have a positive sharp point 16 and our profit is only just 2 dollars 30 minutes This time we have a positive shop 0 and our profit is only just 2 dollars 30 minutes This time shop is negative minus 3 and we lost just 27 dollars
[08:35] Next, 15 minutes time frame. Let's see what we got. Our shop is negative, minus 8.9 but we lost only just 43 dollars. So, that's not much.
[08:47] Next, 5 minutes time frame. Sharpe is very low this time, minus 34 and we lost $40. And finally, one minute time frame, not expecting much.
[09:01] Sharpe is minus 488, but we lost only $65. Now let's get to the results of hyperparameter optimization. We'll check one time frame for each market. So for crypto market we will check for hours.
[09:15] You can see the command here on the top. Here we have our logs and our best result is $873 profit. That's actually quite a lot. We didn't profit anything without optimization.
[09:29] And here you can see our best parameters. Next, US stocks market, 2-hour time frame. Let's see what we have here. Once again logs. And our best result is only just $21 profit.
[09:42] And you can see best parameters here. Our stock market results are not as good as for crypto market. Now futures. Our best result is $22. Not much because futures market was quite good in the doubt optimization.
[09:59] And our best parameters are as seen here. And finally forex market for our timeframe. Let's see what's in it here. Our best result is only $1.3 profit.
[10:11] So that's extremely low. still best parameters are here. And here you can see the final results table with all markets, all time frames, including optimization. So what we can see is it's mostly red, so we mostly lose
[10:24] money, only futures market is more or less positive. But what I want to point out is that if we lose money most of the time, we lose about 40, 50, maybe 100 dollars. Only on crypto market
[10:37] we lose more than a thousand on high frequency time frame. So what I want to say is that here we lose money mostly because of the commission because as you can see we have a lot of trades so this strategy actually can predict when trend reverses but commissions don't let us take profit
[10:56] from this so we always make around zero profit only on higher frequency crypto markets we lose a lot of money but mostly we are around zero so i would say that this strategy needs some
[11:08] improvement and then it may be really profitable but in this version as we tested it's not possible at all.
⚡ Saved you 0h 11m reading this? Transcribe any YouTube video for free — no signup needed.