
The Perfect STARC Sell Setup
45sClear, actionable trading strategy with visual confirmation from indicators, appealing to traders seeking precise entry signals.
▶ Play Clip"The title promises a lesson on not selling too early, and the video delivers exactly that with a real trade example, though it's brief and lacks deeper explanation."
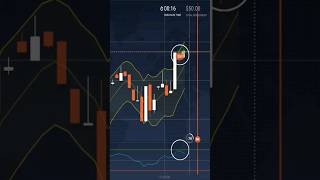
This video demonstrates a specific binary options trading strategy using the STARC bands and CCI indicator. The presenter walks through a real trade example, explaining the entry conditions, market behavior, and the importance of patience in letting the trade reach its full profit potential.
A sell trade was taken at a specific point where price made a sharp upward move and reached the upper STARC band, indicating the market moved away from its average price area.
The CCI indicator also reached its upper extreme zone, confirming that the move was strong in price and stretched in momentum.
The market showed hesitation near the upper band instead of continuously making higher highs, increasing the chance of a short-term pullback.
The sell trade was executed strictly according to strategy rules with a fixed 1-minute expiry.
After entry, price hovered near the entry area, which is normal in extreme zones. Price often pauses, creates uncertainty, and tries to trap impatient traders before making its actual move.
Before the expiry completed, price moved downward and the sell trade closed in profit.
The key takeaway is to trust the strategy and avoid selling too early, as price often pauses in extreme zones before continuing in the expected direction. Patience is crucial for maximizing profits.
What does the upper STARC band indicate?
The market has moved away from its average price area.
00:02
What does the CCI indicator reaching its upper extreme zone confirm?
The move is strong in price and stretched in momentum.
00:14
What market behavior near the upper band increases the chance of a pullback?
Hesitation instead of continuously making higher highs.
00:28
What is the fixed expiry time used in this strategy?
1 minute.
00:41
Why does price often pause near extreme zones?
To create uncertainty and trap impatient traders before making its actual move.
00:55
STARC Band as Overextension Signal
Provides a clear, objective criterion for identifying when price has moved too far from its average, a key principle in mean-reversion trading.
00:02CCI Momentum Confirmation
Combining price and momentum indicators strengthens the signal, reducing false entries.
00:14Patience in Extreme Zones
Explains the psychological trap of exiting early and emphasizes the importance of trusting the strategy.
00:55[00:02] trade was taken at this exact point. If you look at the chart, you'll notice that price made a sharp upward move and reached the upper stark band which already tells us the market has moved away from its average price area. At the
[00:14] same time, when we check the CCI indicator below, it also reached its upper extreme zone. This confirms that the move was not only strong in price but also stretched in momentum. Another key observation here is market behavior.
[00:28] The market was not continuously making higher highs with strength. Instead, it showed hesitation near the upper band, which increases the chance of a short-term pullback. Once all these conditions matched, the sell trade was
[00:41] executed strictly according to the strategy rules with a fixed 1 minute expiry. After entering the sell trade, price did not collapse immediately. Instead, it hovered near the entry area for a short time. This is a normal
[00:55] behavior in extreme zones. Price often pauses, creates uncertainty, and tries to trap impatient traders before making its actual move. Now, let's look at how the trade ended. Before the expiry completed, [music] price moved downward
[01:07] completed, [music] price moved downward and the sell trade closed in profit.




⚡ Saved you 0h 01m reading this? Transcribe any YouTube video for free — no signup needed.