
4-Step Strategy to Master Trend Trading
30sEducational breakdown of trend identification using moving averages, essential for beginners.
▶ Play Clip"Delivers a clear, actionable trading strategy as promised, though the title could be more specific about the four-step approach."
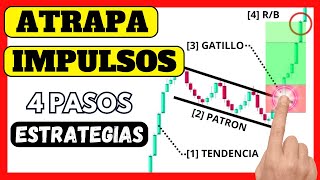
This video presents a four-step trading strategy that combines exponential moving averages, chart patterns, and price action to identify high-probability entries during trend pullbacks. The method focuses on capturing impulsive moves after weak pullbacks, using impulse candles as entry triggers and dynamic risk management with the 20-period EMA.
Use 100-period and 200-period exponential moving averages. In an uptrend, the 100 EMA is above the 200 EMA and both slope upward; in a downtrend, the 100 EMA is below the 200 EMA and both slope downward. Only trade in the direction of the major trend.
Look for weak pullbacks that form wedge or flag patterns with a gentle slope. These indicate the trend is strong and the opposing force is weak. Draw trendlines connecting swing highs and lows to define the pattern boundaries.
Enter when the price breaks the pattern with an impulse candle (large body, short wicks) in the direction of the major trend. Avoid false breakouts by waiting for confirmation from a candle with a large body closing beyond the pattern boundary.
Use the 20-period EMA for dynamic stop-loss. Initially place stop below the pattern boundary (for buys). Take half profit at twice the stop distance, then move stop to breakeven. Trail the remaining position with the 20 EMA until price closes below it.
This four-step strategy helps traders systematically capture impulsive moves after trend pullbacks by combining EMA trend identification, wedge/flag patterns, impulse candle entries, and dynamic risk management to maximize profits while minimizing losses.
What two exponential moving averages are used to determine the major trend?
100-period and 200-period exponential moving averages.
01:06
In an uptrend, where should the 100 EMA be relative to the 200 EMA?
The 100 EMA is above the 200 EMA, and both slope upward.
01:36
What type of pullback is easier to trade according to the strategy?
Weak pullbacks that form consolidation patterns like flags or wedges with a gentle slope.
03:23
What is an impulse candle?
A candle with a large body and short wicks compared to its predecessors, or three consecutive candles in the same direction.
06:00
Where is the initial stop-loss placed for a buy trade?
Below the upper boundary of the pattern, at the 20-period EMA.
07:22
How is the take-profit level determined for the first half of the position?
At twice the distance of the stop-loss from the entry.
07:37
Focus on Weak Pullbacks
Distinguishes between strong and weak pullbacks, emphasizing that weak pullbacks are easier to trade and indicate trend strength.
02:35Avoiding False Breakouts
Teaches to wait for an impulse candle as confirmation, reducing the risk of entering on a false breakout.
05:33Dynamic Risk Management
Uses the 20 EMA as a trailing stop to lock in profits while staying in the trade during strong trends.
07:22[00:02] higher highs and higher lows, forming a channel-like pattern. Can you tell me if the price will break out to the upside or the
[00:20] overall picture. If we look at what the price has been doing previously, sharply through this bearish impulse and is now rising within a wedge-shaped channel. If we can identify that this rise
[00:36] is just a retracement of this bearish movement and not a trend reversal, we could enter at the end of the retracement to capture the next impulsive move. To do this, we'll show you our strategy in four simple
[00:52] our strategy in four simple steps. Step one: Determine the major trend. We must identify long-term trends, as this will be our main trend. During uptrends,
[01:06] we'll look for buying opportunities, and during downtrends, we'll look for selling opportunities. If the price is range-bound, we'll avoid trading during these times. To determine the trend, we'll use two exponential moving averages. The
[01:22] yellow one shows the 100-period exponential moving average, and the blue one shows the 200-period exponential moving average. These moving averages will help us identify the
[01:36] trend. In an uptrend, we'll see that the 100-period EMA is above the 200- period EMA, and both moving averages have period EMA, and both moving averages have an
[01:52] downtrend, we'll see that the 100-period EMA is below the 200-period EMA, and both moving averages have a downward slope. Once we identify the major trend, we must observe the
[02:06] price action of the most recent candlesticks. When the price is trending, the price action follows a zigzag pattern. This means that in an uptrend, we'll observe large upward impulse moves and
[02:22] smaller downward pullbacks, while in a downtrend, the price action shows large downward impulse moves and smaller upward pullbacks. downward impulse moves and smaller upward pullbacks. With this strategy, our
[02:35] goal is to enter at the end of the pullbacks to capture the next impulsive move. To do this, we need to look for channel or wedge-type chart patterns that form during the
[02:53] chart pattern. The structure of the pullbacks can be... There are two types: the first is a strong pullback, and the second is a
[03:08] common and consist of a rapid movement driven by large candlesticks, making them difficult to trade due to their abrupt movement. Then we have weak pullbacks, where the price moves, forming a
[03:23] consolidation pattern with a gentle slope. These pullbacks are quite common and less abrupt, making them easier to detect and trade. They are also known as a flag or wedge pattern. During
[03:38] a trend pullback, we should look for the price to consolidate into these patterns, as this shows that the trend is strong while the opposing force is weak, forming these
[03:51] patterns. So, we should observe the period EMA, forming a consolidation pattern.
[04:03] moving averages, it often returns to them, as moving averages act as dynamic support in an uptrend and dynamic resistance in downtrends. We should only trade where
[04:17] we observe the price reaching the 100-period EMA. Notice how the 100-period EMA... It is located above the 200-period EMA, indicating that we are entering a possible upward trend. So we will look for
[04:33] buying opportunities when the price approaches the 100-period EMA and draw a continuous line connecting the swing highs of the price. Similarly, we will draw another continuous line connecting the swing lows of the
[04:47] price. In this way, we will obtain the type of chart pattern, which in this case is a wedge consolidation pattern. Okay, once we draw the upper limits, let's Okay, once we draw the upper limits, let's
[05:03] support us with a like because this way we can continue sharing more content. Download various trading files for free on our website and join our Telegram community; we are already more than
[05:17] Telegram community; we are already more than 4,000 strong. Step three: entry trigger. As you can see, all these chart patterns have something in common: the price consolidates, reaches two key levels, and finally breaks out in one direction.
[05:33] Most traders usually wait for a breakout in either direction, so once they see the price cross either of the two limits, they immediately enter in the direction of the breakout. But it
[05:47] turns out that It was a false breakout since the price reversed, resulting in a losing trade. I'm going to show you how you can prevent this from happening so you have a higher probability of the price moving
[06:00] in the direction you anticipated. Our entry trigger for the strategy occurs when the price breaks the pattern with an impulse candle. An impulse candle is a candle with a large body and short wicks
[06:14] compared to its predecessors. An impulse candle can also be formed by three consecutive candles in the same direction. For example, if we are in an uptrend previously
[06:29] identified by moving averages and we observe this consolidation pattern, we will enter a buy position when we see that the close of the bullish candle is above the upper boundary of the pattern and that this candle has a
[06:42] large body. This indicates that the price is currently under strong pressure in favor of the main trend. Remember that this strategy identifies explosive movements where our
[06:55] goal is to capture the next impulsive move. To do this, let's move on to impulsive move. To do this, let's move on to
[07:07] Trading is an activity that always involves risks. So, to minimize losses and protect gains, it is important to develop a risk management strategy. For this strategy, we'll use
[07:22] dynamic management. We'll add the 20-period EMA to the chart. In a buy trade, we'll initially place the stock loss at the 20-period EMA, below the upper boundary of the pattern, and position
[07:37] the Tech Prophet at twice the stop-loss distance. Once the price moves in our favor and reaches the target, we'll close only half the position and move the stop-loss to break-even. This way, we've already
[07:51] secured profits with half the position, while the second half will be risk-free. We'll remain in the trade with the second half until the price closes below the 20-
[08:05] period EMA. This way, you'll obtain greater profits by following the upward momentum. Remember, it's all about probabilities, so wait patiently. Good setups, good trading.
⚡ Saved you 0h 08m reading this? Transcribe any YouTube video for free — no signup needed.